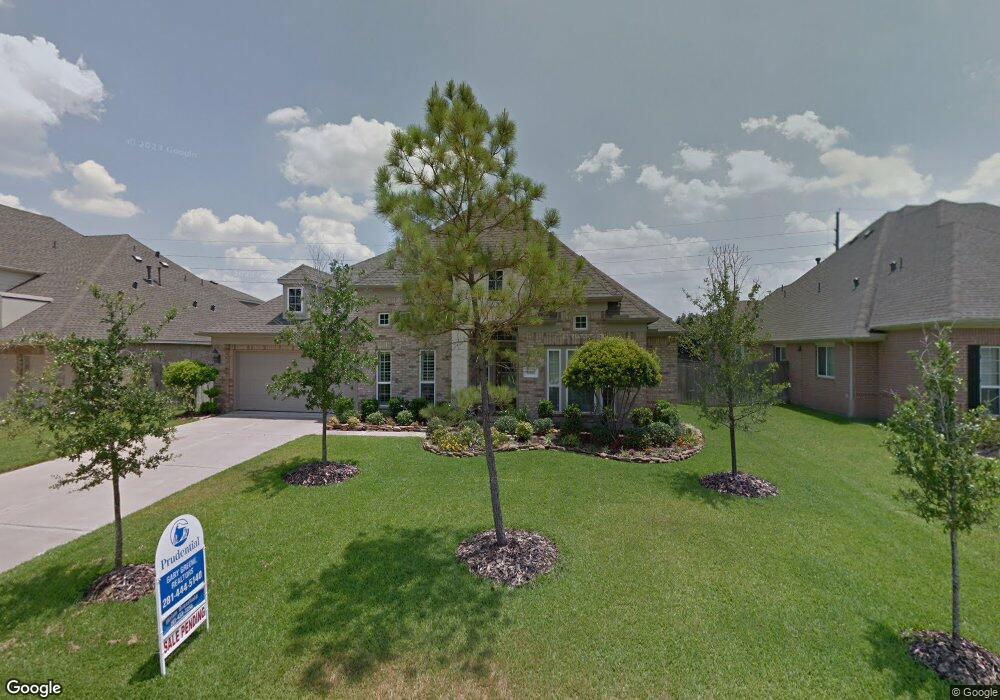
12607 Midland Creek Dr Tomball, TX 77377
Northpointe NeighborhoodEstimated Value: $428,000 - $502,000
4
Beds
3
Baths
2,814
Sq Ft
$161/Sq Ft
Est. Value
About This Home
This home is located at 12607 Midland Creek Dr, Tomball, TX 77377 and is currently estimated at $453,108, approximately $161 per square foot. 12607 Midland Creek Dr is a home located in Harris County with nearby schools including Willow Creek Elementary School, Northpointe Intermediate School, and Willow Wood Junior High School.
Ownership History
Date
Name
Owned For
Owner Type
Purchase Details
Closed on
Jun 9, 2011
Sold by
Zaal Thomas C and Zaal Sharon W
Bought by
Baddock Jace W and Baddock Cheri S
Current Estimated Value
Home Financials for this Owner
Home Financials are based on the most recent Mortgage that was taken out on this home.
Original Mortgage
$243,662
Outstanding Balance
$166,947
Interest Rate
4.5%
Mortgage Type
FHA
Estimated Equity
$286,161
Purchase Details
Closed on
Jan 27, 2006
Sold by
Wilshire Homes Houston Ltd
Bought by
Zaal Thomas C and Zaal Sharon W
Home Financials for this Owner
Home Financials are based on the most recent Mortgage that was taken out on this home.
Original Mortgage
$212,651
Interest Rate
6.18%
Mortgage Type
Fannie Mae Freddie Mac
Create a Home Valuation Report for This Property
The Home Valuation Report is an in-depth analysis detailing your home's value as well as a comparison with similar homes in the area
Home Values in the Area
Average Home Value in this Area
Purchase History
| Date | Buyer | Sale Price | Title Company |
|---|---|---|---|
| Baddock Jace W | -- | Charter Title Company | |
| Zaal Thomas C | -- | Chicago Title Insurance Comp |
Source: Public Records
Mortgage History
| Date | Status | Borrower | Loan Amount |
|---|---|---|---|
| Open | Baddock Jace W | $243,662 | |
| Previous Owner | Zaal Thomas C | $212,651 |
Source: Public Records
Tax History Compared to Growth
Tax History
| Year | Tax Paid | Tax Assessment Tax Assessment Total Assessment is a certain percentage of the fair market value that is determined by local assessors to be the total taxable value of land and additions on the property. | Land | Improvement |
|---|---|---|---|---|
| 2025 | $9,780 | $447,700 | $81,090 | $366,610 |
| 2024 | $9,780 | $453,049 | $76,500 | $376,549 |
| 2023 | $9,780 | $387,819 | $68,850 | $318,969 |
| 2022 | $9,869 | $400,417 | $61,200 | $339,217 |
| 2021 | $9,301 | $308,342 | $49,725 | $258,617 |
| 2020 | $9,068 | $289,842 | $49,725 | $240,117 |
| 2019 | $9,246 | $288,029 | $52,164 | $235,865 |
| 2018 | $3,170 | $261,553 | $52,164 | $209,389 |
| 2017 | $8,482 | $261,553 | $52,164 | $209,389 |
| 2016 | $9,852 | $303,815 | $52,164 | $251,651 |
| 2015 | $8,013 | $303,815 | $52,164 | $251,651 |
| 2014 | $8,013 | $280,144 | $52,164 | $227,980 |
Source: Public Records
Map
Nearby Homes
- 17623 Edengrove Dr
- 12506 Opal Valley Dr
- 12703 Songhollow Dr
- 12802 Mossy Ledge Dr
- 12611 Wandering Streams Dr
- 12806 Wandering Streams Dr
- 19307 Hillside Pasture Ln
- 20618 Yearling Pasture Ln
- 19243 Palfrey Prairie Trail
- 19219 Palfrey Prairie Trail
- 19326 Palfrey Prairie Trail
- 12823 Mossy Ledge Dr
- 17511 Pecks Park Ct
- 12730 Holsberry Ct
- 12902 Frontier Creek Ct
- 17814 Winkler Willow Ct
- 18402 Sierra Falls Ct
- 12331 Westwold Dr
- 12427 Pedder Way Dr
- 18218 Russett Green Dr
- 12603 Midland Creek Dr
- 12611 Midland Creek Dr
- 12606 Willow Breeze Dr
- 12615 Midland Creek Dr
- 12602 Willow Breeze Dr
- 12610 Willow Breeze Dr
- 12531 Midland Creek Dr
- 17603 Cloverview Dr
- 12606 Midland Creek Dr
- 12534 Willow Breeze Dr
- 12602 Midland Creek Dr
- 12614 Willow Breeze Dr
- 12619 Midland Creek Dr
- 12530 Willow Breeze Dr
- 12526 Midland Creek Dr
- 17607 Cloverview Dr
- 12618 Willow Breeze Dr
- 12618 Midland Creek Dr
- 17511 Days Dawn Dr
- 12623 Midland Creek Dr