Estimated Value: $1,675,000 - $1,755,000
4
Beds
3
Baths
3,099
Sq Ft
$550/Sq Ft
Est. Value
About This Home
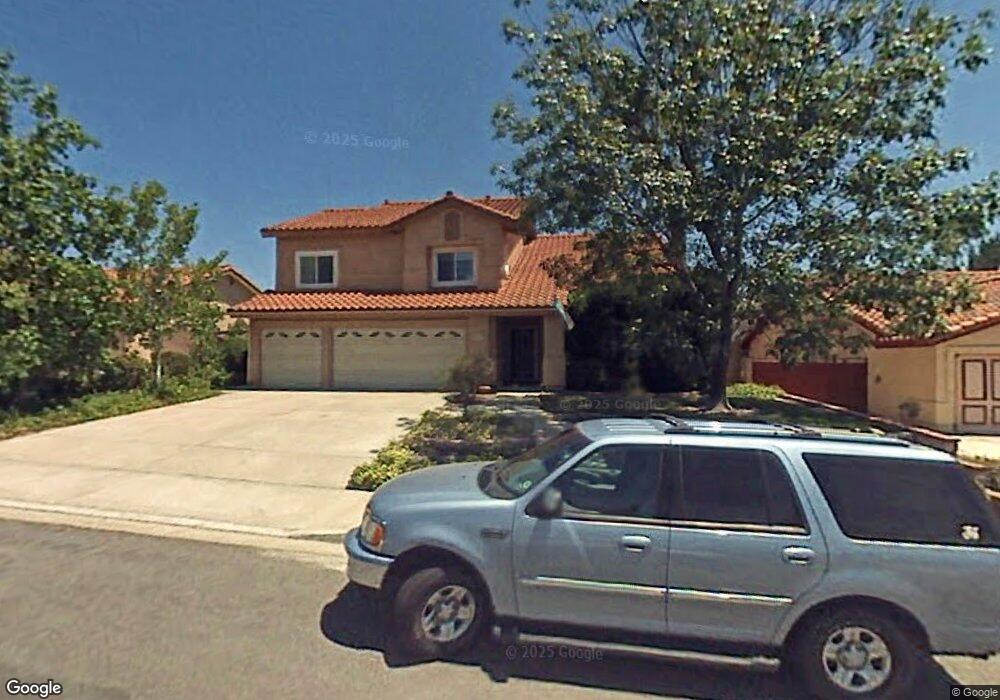
This home is located at 12608 Hedgetree Ct, Poway, CA 92064 and is currently estimated at $1,703,992, approximately $549 per square foot. 12608 Hedgetree Ct is a home located in San Diego County with nearby schools including Tierra Bonita Elementary, Twin Peaks Middle, and Poway High.
Ownership History
Date
Name
Owned For
Owner Type
Purchase Details
Closed on
Mar 16, 2006
Sold by
Morse James F and Morse Kimberly H
Bought by
Morse James Ford and Morse Kimberly Hulden
Current Estimated Value
Purchase Details
Closed on
May 16, 1995
Sold by
Wright Quastler Reba
Bought by
Quastler Imre E and Wright Quastler Reba
Home Financials for this Owner
Home Financials are based on the most recent Mortgage that was taken out on this home.
Original Mortgage
$98,500
Interest Rate
6.87%
Purchase Details
Closed on
May 9, 1995
Sold by
Quastler Reba Wright
Bought by
Morse James F and Morse Kimberly H
Home Financials for this Owner
Home Financials are based on the most recent Mortgage that was taken out on this home.
Original Mortgage
$98,500
Interest Rate
6.87%
Purchase Details
Closed on
Dec 22, 1994
Sold by
Wright Nellie B and Wright Quastler Reba
Bought by
Wright Quastler Reba and Wright Nellie B
Purchase Details
Closed on
Aug 19, 1987
Create a Home Valuation Report for This Property
The Home Valuation Report is an in-depth analysis detailing your home's value as well as a comparison with similar homes in the area
Home Values in the Area
Average Home Value in this Area
Purchase History
| Date | Buyer | Sale Price | Title Company |
|---|---|---|---|
| Morse James Ford | -- | None Available | |
| Quastler Imre E | -- | American Title Insurance Co | |
| Morse James F | $368,500 | American Title Insurance Co | |
| Wright Quastler Reba | -- | -- | |
| -- | $223,000 | -- |
Source: Public Records
Mortgage History
| Date | Status | Borrower | Loan Amount |
|---|---|---|---|
| Previous Owner | Morse James F | $98,500 |
Source: Public Records
Tax History
| Year | Tax Paid | Tax Assessment Tax Assessment Total Assessment is a certain percentage of the fair market value that is determined by local assessors to be the total taxable value of land and additions on the property. | Land | Improvement |
|---|---|---|---|---|
| 2025 | $7,385 | $659,385 | $149,501 | $509,884 |
| 2024 | $7,385 | $646,457 | $146,570 | $499,887 |
| 2023 | $7,231 | $633,783 | $143,697 | $490,086 |
| 2022 | $7,112 | $621,357 | $140,880 | $480,477 |
| 2021 | $7,021 | $609,174 | $138,118 | $471,056 |
| 2020 | $6,927 | $602,928 | $136,702 | $466,226 |
| 2019 | $6,750 | $591,107 | $134,022 | $457,085 |
| 2018 | $6,564 | $579,518 | $131,395 | $448,123 |
| 2017 | $172 | $568,156 | $128,819 | $439,337 |
| 2016 | $6,263 | $557,017 | $126,294 | $430,723 |
| 2015 | $6,171 | $548,651 | $124,397 | $424,254 |
| 2014 | $6,029 | $537,905 | $121,961 | $415,944 |
Source: Public Records
Map
Nearby Homes
- 14725 Fieldview Way
- 14109 Arbolitos Dr
- 14811 Summerbreeze Way
- 0 La Manda Dr Unit 260002248
- 12834 Rockwell Ct
- 12885 Rockwell Ct
- 14230 Jonah Way
- 14138 Brent Wilsey Place Unit 3
- 14110 Brent Wilsey Place Unit 1
- Hawkeye Waverly Downs Way Unit A70
- 14334 Sandown Ct
- 11908 Tivoli Park Row Unit 7
- 14240 Kendra Way
- 14120 Kendra Way
- 14403 Gaslight Ct
- 12333 Bachimba Ct
- 14215 Jonah Way
- 13780 Holly Oak Way
- 13641 Carriage Rd
- 13765 Holly Oak Way
- 12614 Hedgetree Ct
- 12602 Hedgetree Ct
- 12620 Hedgetree Ct
- 12607 Stoutwood St
- 12613 Stoutwood St
- 12601 Stoutwood St
- 12619 Stoutwood St
- 12609 Hedgetree Ct
- 12626 Hedgetree Ct
- 12603 Hedgetree Ct
- 12615 Hedgetree Ct
- 14720 Brookstone Dr
- 12621 Hedgetree Ct
- 12625 Stoutwood St
- 14704 Brookstone Dr
- 14736 Brookstone Dr
- 14752 Brookstone Dr
- 12632 Hedgetree Ct
- 14688 Brookstone Dr
- 12627 Hedgetree Ct
Your Personal Tour Guide
Ask me questions while you tour the home.