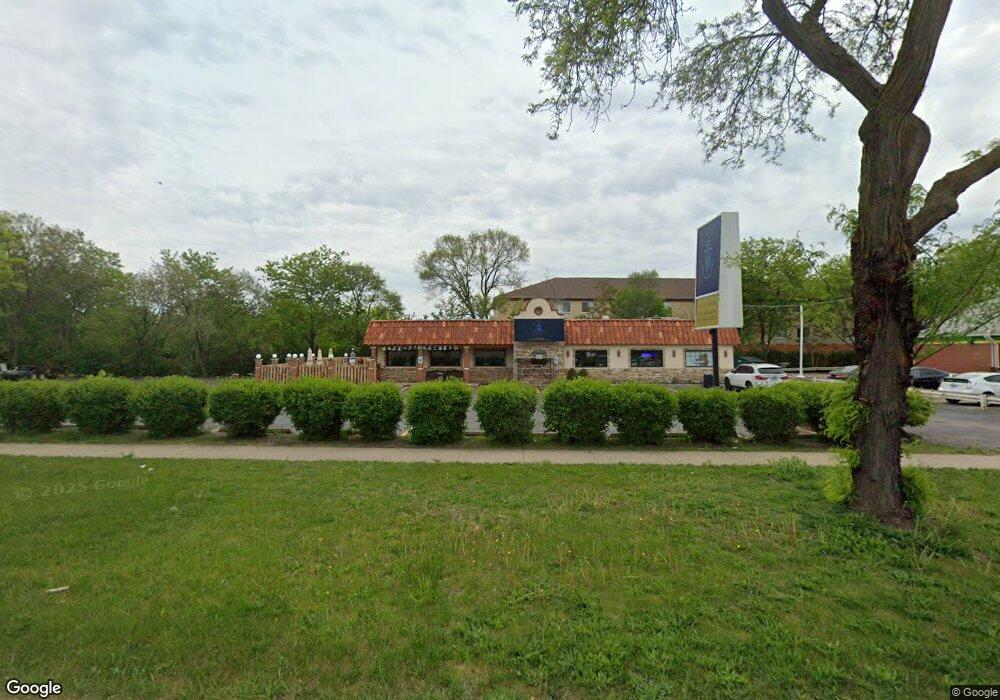
1261 E Algonquin Rd Des Plaines, IL 60016
Studio
--
Bath
2,500
Sq Ft
0.29
Acres
About This Home
This home is located at 1261 E Algonquin Rd, Des Plaines, IL 60016. 1261 E Algonquin Rd is a home located in Cook County with nearby schools including Forest Elementary School, Algonquin Middle School, and Maine West High School.
Ownership History
Date
Name
Owned For
Owner Type
Purchase Details
Closed on
Sep 30, 2022
Sold by
Rosal Properties Llc-1261 Algonquin Seri
Bought by
D & J Brothers Corp
Home Financials for this Owner
Home Financials are based on the most recent Mortgage that was taken out on this home.
Original Mortgage
$424,000
Outstanding Balance
$406,653
Interest Rate
6.25%
Mortgage Type
New Conventional
Purchase Details
Closed on
Feb 6, 2020
Sold by
Roman Areli Salgado
Bought by
Rosal Prop Llc 1261 Algnquin Series
Purchase Details
Closed on
Aug 29, 2008
Sold by
Delicias Inc
Bought by
Salgado Ruben
Home Financials for this Owner
Home Financials are based on the most recent Mortgage that was taken out on this home.
Original Mortgage
$700,000
Interest Rate
6.75%
Mortgage Type
Commercial
Purchase Details
Closed on
Dec 19, 2005
Sold by
Chicago Title Land Trust Co
Bought by
Delicias Inc
Home Financials for this Owner
Home Financials are based on the most recent Mortgage that was taken out on this home.
Original Mortgage
$317,500
Interest Rate
6.34%
Mortgage Type
Commercial
Create a Home Valuation Report for This Property
The Home Valuation Report is an in-depth analysis detailing your home's value as well as a comparison with similar homes in the area
Home Values in the Area
Average Home Value in this Area
Purchase History
| Date | Buyer | Sale Price | Title Company |
|---|---|---|---|
| D & J Brothers Corp | $530,000 | Greater Illinois Title | |
| Rosal Prop Llc 1261 Algnquin Series | -- | Attorney | |
| Salgado Ruben | $842,000 | Stewart Title Of Illinois | |
| Delicias Inc | $535,000 | Cti |
Source: Public Records
Mortgage History
| Date | Status | Borrower | Loan Amount |
|---|---|---|---|
| Open | D & J Brothers Corp | $424,000 | |
| Previous Owner | Salgado Ruben | $700,000 | |
| Previous Owner | Delicias Inc | $317,500 |
Source: Public Records
Tax History Compared to Growth
Tax History
| Year | Tax Paid | Tax Assessment Tax Assessment Total Assessment is a certain percentage of the fair market value that is determined by local assessors to be the total taxable value of land and additions on the property. | Land | Improvement |
|---|---|---|---|---|
| 2025 | $16,791 | $99,953 | $95,794 | $4,159 |
| 2024 | $16,791 | $63,764 | $59,605 | $4,159 |
| 2023 | $16,388 | $63,688 | $59,605 | $4,083 |
| 2022 | $16,388 | $63,688 | $59,605 | $4,083 |
| 2021 | $18,368 | $59,755 | $59,605 | $150 |
| 2020 | $18,058 | $59,755 | $59,605 | $150 |
| 2019 | $16,260 | $60,421 | $59,605 | $816 |
| 2018 | $12,311 | $41,165 | $38,317 | $2,848 |
| 2017 | $11,907 | $40,529 | $38,317 | $2,212 |
| 2016 | $11,209 | $40,339 | $38,317 | $2,022 |
| 2015 | $10,576 | $34,982 | $34,060 | $922 |
| 2014 | $11,020 | $37,238 | $34,060 | $3,178 |
| 2013 | $10,746 | $37,238 | $34,060 | $3,178 |
Source: Public Records
Map
Nearby Homes
- 1489 E Algonquin Rd
- 1365 Ashland Ave Unit 604
- 905 Center St Unit B208
- 1394 Carol Ln
- 1050 E Oakton St
- 1524 Oakwood Ave
- 799 Graceland Ave Unit 504A
- 799 Graceland Ave Unit 404A
- 843 Lexington Cir E
- 1436 E Thacker St Unit 309
- 1673 Spruce Ave
- 821 Lexington Cir E
- 1056 E Villa Dr
- 1700 E Forest Ave
- 1162 W Grant Dr
- 825 Pearson St Unit 3D
- 1696 S Elm St
- 1689 S Elm St
- 881 E Thacker St
- 886 E Thacker St
- 1261 E Algonquin Rd Unit 1
- 1255 Lee St
- 1171 Lee St
- 1283 E Algonquin Rd
- 1283 E Algonquin Rd
- 1275 Lee St
- 1290 Van Buren Ave
- 1291 E Algonquin Rd
- 1294 Van Buren Ave
- 1299 E Algonquin Rd
- 1267 Campbell Ave
- 1290 E Algonquin Rd
- 1173 E Algonquin Rd
- 1302 Van Buren Ave
- 1275 Campbell Ave
- 1287 Van Buren Ave
- 1262 Lee St
- 1302 E Algonquin Rd
- 1167 E Algonquin Rd
- 1295 Van Buren Ave