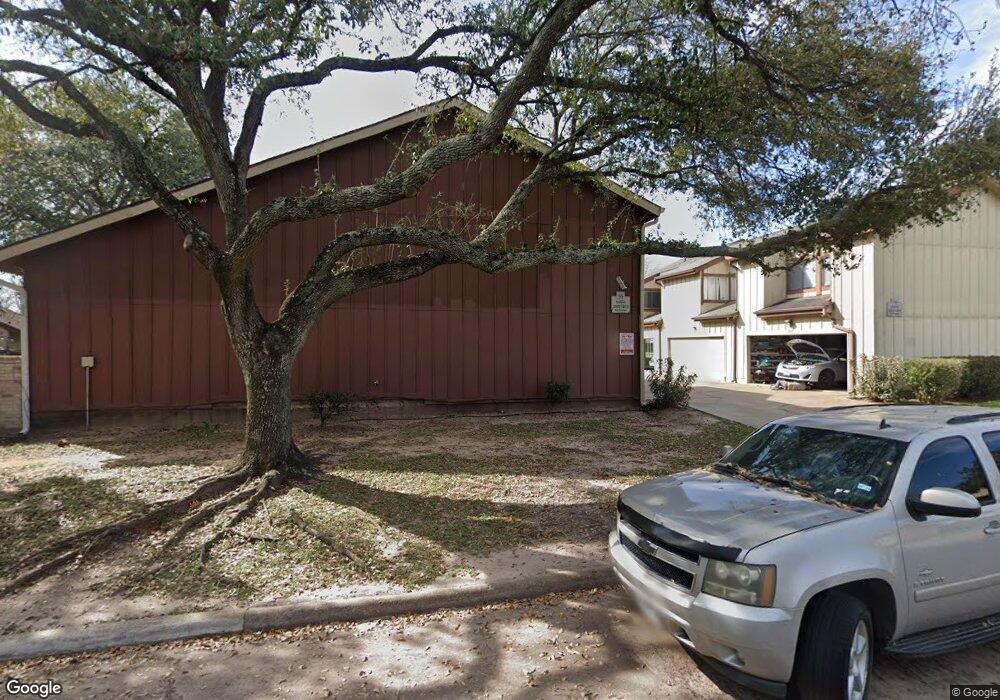
12613 Newbrook Dr Unit 553 Houston, TX 77072
Alief NeighborhoodEstimated Value: $137,591 - $164,000
4
Beds
2
Baths
1,143
Sq Ft
$134/Sq Ft
Est. Value
About This Home
This home is located at 12613 Newbrook Dr Unit 553, Houston, TX 77072 and is currently estimated at $153,648, approximately $134 per square foot. 12613 Newbrook Dr Unit 553 is a home located in Harris County with nearby schools including Alexander Elementary School, Youngblood Intermediate School, and Holub Middle School.
Ownership History
Date
Name
Owned For
Owner Type
Purchase Details
Closed on
Sep 17, 2004
Sold by
Ramos Mardoqueo
Bought by
Miranda Santos C
Current Estimated Value
Purchase Details
Closed on
Aug 4, 1997
Sold by
Perez Daniel
Bought by
Miranda Santos C and Ramos Mardoqueo
Home Financials for this Owner
Home Financials are based on the most recent Mortgage that was taken out on this home.
Original Mortgage
$33,695
Interest Rate
7.6%
Mortgage Type
Seller Take Back
Purchase Details
Closed on
Mar 1, 1995
Sold by
Ferreira Roque A and Ferreira Beatriz
Bought by
Perez Daniel
Home Financials for this Owner
Home Financials are based on the most recent Mortgage that was taken out on this home.
Original Mortgage
$34,200
Interest Rate
9%
Create a Home Valuation Report for This Property
The Home Valuation Report is an in-depth analysis detailing your home's value as well as a comparison with similar homes in the area
Home Values in the Area
Average Home Value in this Area
Purchase History
| Date | Buyer | Sale Price | Title Company |
|---|---|---|---|
| Miranda Santos C | -- | -- | |
| Miranda Santos C | -- | -- | |
| Perez Daniel | -- | Texas American Title Company |
Source: Public Records
Mortgage History
| Date | Status | Borrower | Loan Amount |
|---|---|---|---|
| Closed | Miranda Santos C | $33,695 | |
| Previous Owner | Perez Daniel | $34,200 | |
| Closed | Miranda Santos C | $0 |
Source: Public Records
Tax History Compared to Growth
Tax History
| Year | Tax Paid | Tax Assessment Tax Assessment Total Assessment is a certain percentage of the fair market value that is determined by local assessors to be the total taxable value of land and additions on the property. | Land | Improvement |
|---|---|---|---|---|
| 2025 | $3,167 | $137,425 | $30,695 | $106,730 |
| 2024 | $3,167 | $139,402 | $30,695 | $108,707 |
| 2023 | $3,167 | $141,378 | $30,695 | $110,683 |
| 2022 | $2,805 | $115,634 | $24,556 | $91,078 |
| 2021 | $2,547 | $104,325 | $18,417 | $85,908 |
| 2020 | $2,499 | $98,819 | $18,417 | $80,402 |
| 2019 | $1,511 | $89,930 | $13,045 | $76,885 |
| 2018 | $331 | $84,318 | $10,743 | $73,575 |
| 2017 | $1,237 | $84,318 | $10,743 | $73,575 |
| 2016 | $1,124 | $65,166 | $10,743 | $54,423 |
| 2015 | $621 | $52,430 | $10,743 | $41,687 |
| 2014 | $621 | $44,529 | $10,743 | $33,786 |
Source: Public Records
Map
Nearby Homes
- 12606 Newbrook Dr
- 12552 Newbrook Dr
- 12581 Wellington Park Dr
- 12522 Lima Dr
- 12668 Newbrook Dr Unit 495
- 12632 Newbrook Dr
- 12678 Newbrook Dr Unit 463
- 12682 Newbrook Dr
- 12543 Wellington Park Dr
- 12605 Wellington Park Dr Unit 17
- 8532 Dairy View Ln
- 8612 Dairy View Ln
- 12525 Wellington Park Dr
- 8907 S Dairy Ashford Rd
- 12510 Shannon Hills Dr
- 12712 Plummersville St
- 8494 Dairy View Ln
- 12431 Bexley Dr
- 12420 Newbrook Dr
- 12722 Yoshino Cherry St
- 12613 Newbrook Dr
- 12611 Newbrook Dr
- 12609 Newbrook Dr
- 12615 Newbrook Dr
- 12615 Newbrook Dr Unit 541
- 12617 Newbrook Dr
- 12619 Newbrook Dr Unit 543
- 12603 Newbrook Dr
- 12605 Newbrook Dr Unit 28
- 12607 Newbrook Dr
- 12656 Newbrook Dr
- 12658 Newbrook Dr Unit 511
- 12654 Newbrook Dr
- 12652 Newbrook Dr
- 12625 Newbrook Dr
- 12625 Newbrook Dr Unit 533
- 12623 Newbrook Dr
- 12623 Newbrook Dr Unit 532
- 12602 Newbrook Dr
- 12621 Newbrook Dr