12615 N Condor Rd Peyton, CO 80831
Falcon NeighborhoodEstimated Value: $418,000 - $490,000
3
Beds
2
Baths
1,622
Sq Ft
$276/Sq Ft
Est. Value
About This Home
This home is located at 12615 N Condor Rd, Peyton, CO 80831 and is currently estimated at $447,333, approximately $275 per square foot. 12615 N Condor Rd is a home located in El Paso County with nearby schools including Falcon Elementary School Of Technology, Clifford Street Elementary School, and City Terrace Elementary School.
Ownership History
Date
Name
Owned For
Owner Type
Purchase Details
Closed on
Sep 12, 2008
Sold by
The Bank Of New York
Bought by
Pritchard Hildegard and Pritchard Roy A
Current Estimated Value
Home Financials for this Owner
Home Financials are based on the most recent Mortgage that was taken out on this home.
Original Mortgage
$144,700
Outstanding Balance
$96,476
Interest Rate
6.57%
Mortgage Type
VA
Estimated Equity
$350,857
Purchase Details
Closed on
Oct 1, 2001
Sold by
Vandyke William E and Vandyke Peggy A
Bought by
Stegner Duane K and Stegner April A
Home Financials for this Owner
Home Financials are based on the most recent Mortgage that was taken out on this home.
Original Mortgage
$132,471
Interest Rate
7.03%
Mortgage Type
Construction
Purchase Details
Closed on
Apr 7, 1996
Sold by
Ecklund Craig S and Ecklund Joseph C
Bought by
Vandyke William E and Vandyke Peggy A
Purchase Details
Closed on
Feb 1, 1977
Bought by
Pritchard Roy A
Create a Home Valuation Report for This Property
The Home Valuation Report is an in-depth analysis detailing your home's value as well as a comparison with similar homes in the area
Home Values in the Area
Average Home Value in this Area
Purchase History
| Date | Buyer | Sale Price | Title Company |
|---|---|---|---|
| Pritchard Hildegard | $144,700 | Landamerica | |
| Stegner Duane K | -- | -- | |
| Vandyke William E | -- | -- | |
| Pritchard Roy A | -- | -- |
Source: Public Records
Mortgage History
| Date | Status | Borrower | Loan Amount |
|---|---|---|---|
| Open | Pritchard Hildegard | $144,700 | |
| Previous Owner | Stegner Duane K | $132,471 |
Source: Public Records
Tax History Compared to Growth
Tax History
| Year | Tax Paid | Tax Assessment Tax Assessment Total Assessment is a certain percentage of the fair market value that is determined by local assessors to be the total taxable value of land and additions on the property. | Land | Improvement |
|---|---|---|---|---|
| 2025 | $1,918 | $30,730 | -- | -- |
| 2024 | $1,811 | $30,850 | $8,720 | $22,130 |
| 2023 | $1,811 | $30,850 | $8,720 | $22,130 |
| 2022 | $1,620 | $23,340 | $6,720 | $16,620 |
| 2021 | $1,686 | $24,020 | $6,920 | $17,100 |
| 2020 | $1,519 | $21,540 | $5,400 | $16,140 |
| 2019 | $1,505 | $21,540 | $5,400 | $16,140 |
| 2018 | $1,201 | $16,900 | $4,900 | $12,000 |
| 2017 | $1,100 | $16,900 | $4,900 | $12,000 |
| 2016 | $1,019 | $15,450 | $5,180 | $10,270 |
| 2015 | $1,020 | $15,450 | $5,180 | $10,270 |
| 2014 | $945 | $14,040 | $4,780 | $9,260 |
Source: Public Records
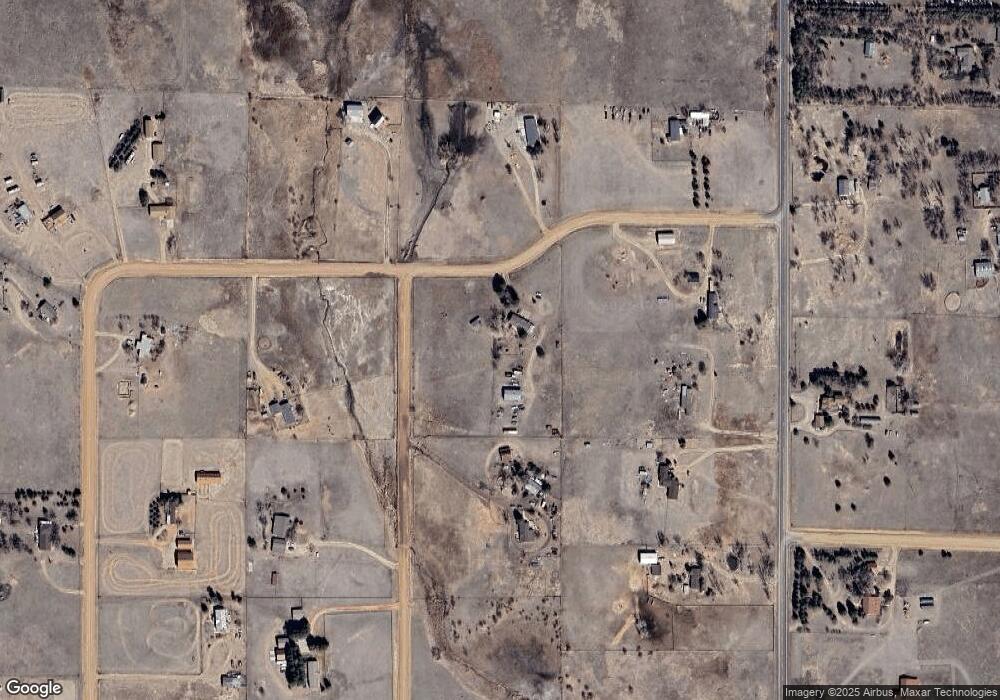
Map
Nearby Homes
- 5865 E Blaney Rd
- 6275 Meridian Rd
- 12565 Richardson Ln
- 6545 Connie Lee Ct
- 7335 Chelsey Way
- 11401 Highway 24
- 7110 Old Meridian Rd
- 12480 Partridge Ln
- 7394 Owings Point
- 7513 Jaoul Point
- 7524 Stephenville Rd
- 7507 Soane Grove
- 7544 Jaoul Point
- 11856 Gorman Grove
- 11893 Trissino Heights
- 7632 Eolus Grove
- 7627 Loopout Grove
- 10970 Garrett Rd
- 7682 Capel Point
- 7651 Loopout Grove
- 6005 Sunset Trail
- 12610 N Condor Rd
- 6020 E Blaney Rd
- 12730 N Condor Rd
- 12520 N Condor Rd
- 6130 Sunset Trail
- 5950 E Blaney Rd
- 6010 Sunset Trail
- 6085 E Blaney Rd
- 12460 N Condor Rd
- 6175 E Blaney Rd
- 6095 W Condor Rd
- 5910 Sunset Trail
- 6015 W Condor Rd
- 5905 Sunset Trail
- 12745 Falcon Hwy
- 5945 E Blaney Rd
- 6050 Wagon Wheel Dr
- 6080 W Condor Rd
- 12410 N Condor Rd