Estimated Value: $784,000 - $996,000
5
Beds
3
Baths
2,622
Sq Ft
$338/Sq Ft
Est. Value
About This Home
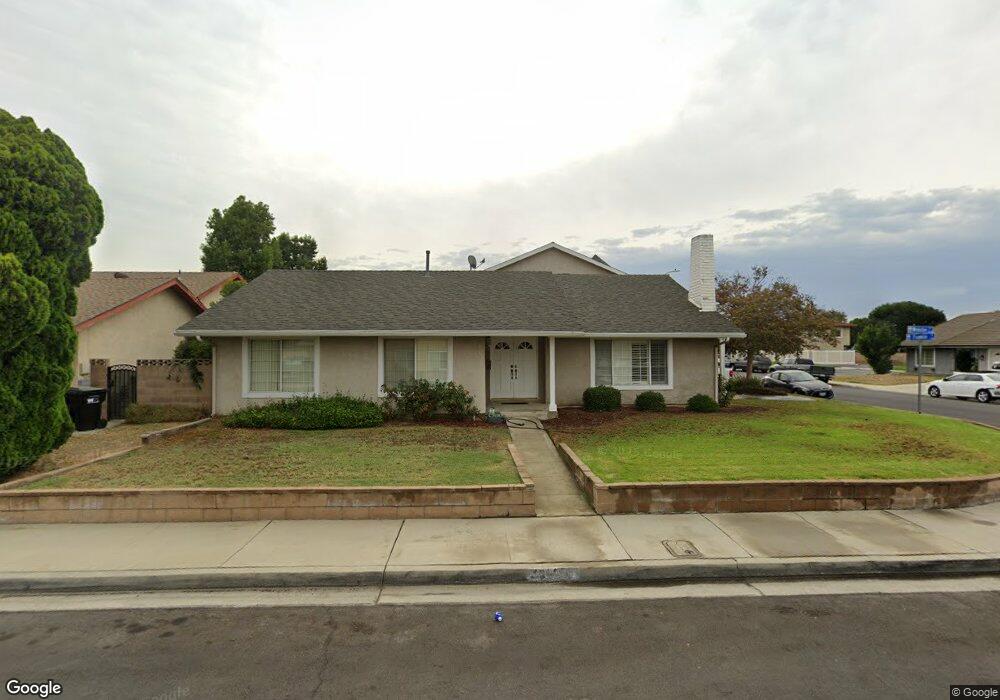
This home is located at 12625 Webster Ct, Chino, CA 91710 and is currently estimated at $885,608, approximately $337 per square foot. 12625 Webster Ct is a home located in San Bernardino County with nearby schools including Newman Elementary, Ramona Junior High School, and Don Antonio Lugo High School.
Ownership History
Date
Name
Owned For
Owner Type
Purchase Details
Closed on
Jun 14, 2017
Sold by
Phillps Randy G
Bought by
Phillips Randy and Blodgett Lisa
Current Estimated Value
Purchase Details
Closed on
Dec 15, 2004
Sold by
Phillips Desiree
Bought by
Phillips Randy G
Home Financials for this Owner
Home Financials are based on the most recent Mortgage that was taken out on this home.
Original Mortgage
$348,000
Interest Rate
5.74%
Mortgage Type
New Conventional
Purchase Details
Closed on
May 1, 2003
Sold by
Phillips Randy G
Bought by
Phillips Randy G
Home Financials for this Owner
Home Financials are based on the most recent Mortgage that was taken out on this home.
Original Mortgage
$128,000
Interest Rate
5.84%
Mortgage Type
Credit Line Revolving
Purchase Details
Closed on
Oct 4, 1994
Sold by
Erdahl Lynne M
Bought by
Phillips Randy G
Purchase Details
Closed on
Sep 20, 1993
Sold by
Phillips Jeff
Bought by
Phillips Randy G and Erdahl Lynne M
Create a Home Valuation Report for This Property
The Home Valuation Report is an in-depth analysis detailing your home's value as well as a comparison with similar homes in the area
Home Values in the Area
Average Home Value in this Area
Purchase History
| Date | Buyer | Sale Price | Title Company |
|---|---|---|---|
| Phillips Randy | -- | None Available | |
| Phillips Randy G | -- | North American Title Company | |
| Phillips Randy G | -- | Old Republic Title | |
| Phillips Randy G | -- | -- | |
| Phillips Randy G | -- | Old Republic Title Company |
Source: Public Records
Mortgage History
| Date | Status | Borrower | Loan Amount |
|---|---|---|---|
| Previous Owner | Phillips Randy G | $348,000 | |
| Previous Owner | Phillips Randy G | $128,000 |
Source: Public Records
Tax History Compared to Growth
Tax History
| Year | Tax Paid | Tax Assessment Tax Assessment Total Assessment is a certain percentage of the fair market value that is determined by local assessors to be the total taxable value of land and additions on the property. | Land | Improvement |
|---|---|---|---|---|
| 2025 | $3,987 | $366,536 | $95,259 | $271,277 |
| 2024 | $3,987 | $359,349 | $93,391 | $265,958 |
| 2023 | $3,877 | $352,303 | $91,560 | $260,743 |
| 2022 | $3,854 | $345,395 | $89,765 | $255,630 |
| 2021 | $3,779 | $338,623 | $88,005 | $250,618 |
| 2020 | $3,653 | $335,151 | $87,103 | $248,048 |
| 2019 | $3,588 | $328,579 | $85,395 | $243,184 |
| 2018 | $3,507 | $322,137 | $83,721 | $238,416 |
| 2017 | $3,443 | $315,820 | $82,079 | $233,741 |
| 2016 | $3,216 | $309,628 | $80,470 | $229,158 |
| 2015 | $3,151 | $304,977 | $79,261 | $225,716 |
| 2014 | $3,087 | $299,003 | $77,708 | $221,295 |
Source: Public Records
Map
Nearby Homes
- 12635 Franklin Ct Unit 8b
- 4862 Lincoln Ave
- 5382 Park Place
- 12939 5th St
- 12940 4th St
- 12836 12th St Unit 27
- 13066 3rd St
- 13116 3rd St
- 13123 2nd St
- 13115 Monte Vista Ave
- 5640 Riverside Dr Unit 119
- 5610 Guardian Way
- 0 C St
- 4887 Philadelphia St
- 12139 Serra Ave
- 12351 Twin Gables Dr
- 13257 2nd St
- 12540 Ramona Ave
- 4965 Independence St
- 12796 17th St
- 12615 Webster Ct
- 12603 Webster Ct
- 5157 Franklin Ct
- 5147 Franklin Ct
- 5134 Franklin Ct
- 5139 Franklin Ct
- 12595 Webster Ct
- 12632 Franklin Ct Unit 11C
- 12606 Webster Ct
- 5131 Franklin Ct
- 12615 Telephone Ave
- 12594 Webster Ct
- 12583 Webster Ct
- 5121 Franklin Ct
- 12607 Telephone Ave
- 12582 Webster Ct
- 5111 Franklin Ct
- 12635 Franklin Ct Unit 3A
- 12635 Franklin Ct Unit 1B
- 12635 Franklin Ct Unit 5A