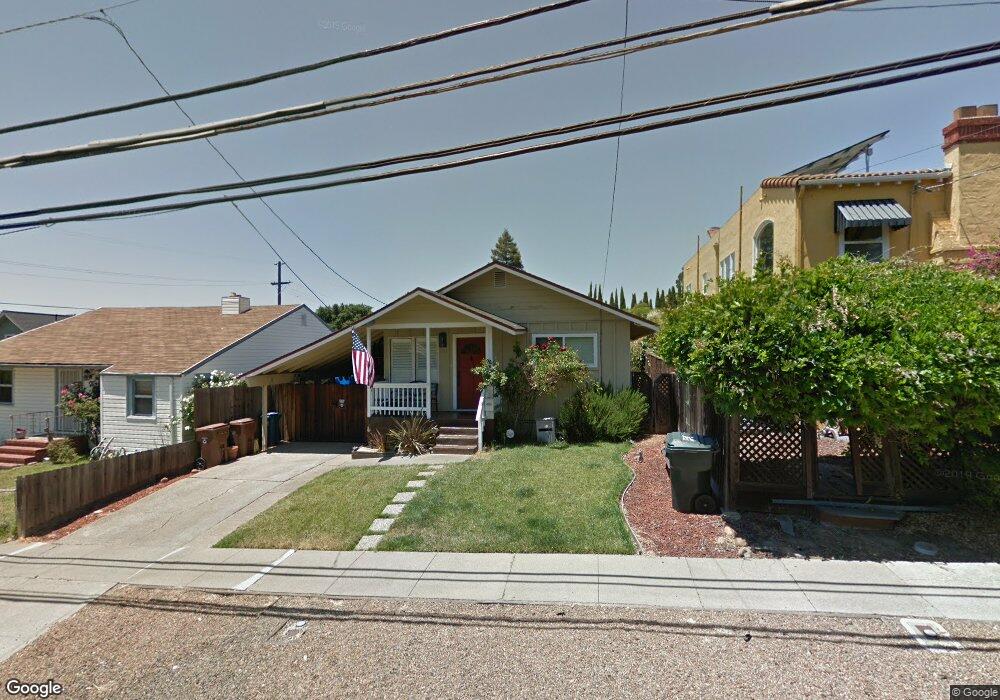
1263 E 3rd St Benicia, CA 94510
Estimated Value: $582,220 - $739,000
2
Beds
2
Baths
1,344
Sq Ft
$511/Sq Ft
Est. Value
About This Home
This home is located at 1263 E 3rd St, Benicia, CA 94510 and is currently estimated at $686,805, approximately $511 per square foot. 1263 E 3rd St is a home located in Solano County with nearby schools including Mary Farmar Elementary School, Benicia Middle School, and Benicia High School.
Ownership History
Date
Name
Owned For
Owner Type
Purchase Details
Closed on
May 16, 2024
Sold by
Maginniss Larry E and Maginniss Dolores
Bought by
Larry And Dolores Maginniss 2024 Trust and Maginniss
Current Estimated Value
Purchase Details
Closed on
Jul 22, 1993
Sold by
Maginniss Larry E and Maginniss Dolores Dora
Bought by
Maginniss Larry E and Maginniss Dolores Dora
Home Financials for this Owner
Home Financials are based on the most recent Mortgage that was taken out on this home.
Original Mortgage
$127,000
Interest Rate
3.87%
Create a Home Valuation Report for This Property
The Home Valuation Report is an in-depth analysis detailing your home's value as well as a comparison with similar homes in the area
Home Values in the Area
Average Home Value in this Area
Purchase History
| Date | Buyer | Sale Price | Title Company |
|---|---|---|---|
| Larry And Dolores Maginniss 2024 Trust | -- | None Listed On Document | |
| Maginniss Larry E | -- | Northwestern Title Warmsprin |
Source: Public Records
Mortgage History
| Date | Status | Borrower | Loan Amount |
|---|---|---|---|
| Previous Owner | Maginniss Larry E | $127,000 |
Source: Public Records
Tax History
| Year | Tax Paid | Tax Assessment Tax Assessment Total Assessment is a certain percentage of the fair market value that is determined by local assessors to be the total taxable value of land and additions on the property. | Land | Improvement |
|---|---|---|---|---|
| 2025 | $2,910 | $254,805 | $64,386 | $190,419 |
| 2024 | $2,910 | $249,810 | $63,125 | $186,685 |
| 2023 | $2,839 | $244,913 | $61,888 | $183,025 |
| 2022 | $2,785 | $240,112 | $60,675 | $179,437 |
| 2021 | $2,727 | $235,405 | $59,486 | $175,919 |
| 2020 | $2,690 | $232,993 | $58,877 | $174,116 |
| 2019 | $2,642 | $228,425 | $57,723 | $170,702 |
| 2018 | $2,573 | $223,947 | $56,592 | $167,355 |
| 2017 | $2,512 | $219,557 | $55,483 | $164,074 |
| 2016 | $2,525 | $215,253 | $54,396 | $160,857 |
| 2015 | $2,459 | $212,020 | $53,579 | $158,441 |
| 2014 | $2,429 | $207,868 | $52,530 | $155,338 |
Source: Public Records
Map
Nearby Homes
Your Personal Tour Guide
Ask me questions while you tour the home.