1263 E 69th St Brooklyn, NY 11234
Bergen Beach NeighborhoodEstimated Value: $1,149,725 - $1,384,000
8
Beds
6
Baths
3,894
Sq Ft
$330/Sq Ft
Est. Value
About This Home
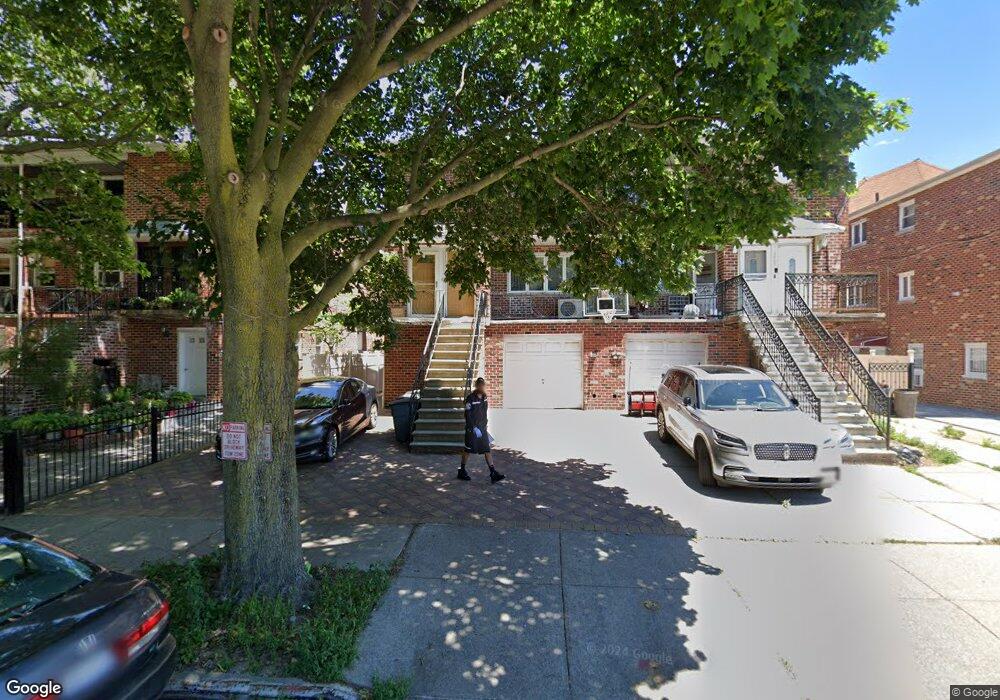
This home is located at 1263 E 69th St, Brooklyn, NY 11234 and is currently estimated at $1,283,681, approximately $329 per square foot. 1263 E 69th St is a home located in Kings County with nearby schools including P.S. 312 Bergen Beach, Success Academy Charter School - Bergen Beach, and St. Bernard Catholic Academy.
Ownership History
Date
Name
Owned For
Owner Type
Purchase Details
Closed on
Jul 9, 2012
Sold by
Dulber Neruse
Bought by
Auguste Vladimir
Current Estimated Value
Home Financials for this Owner
Home Financials are based on the most recent Mortgage that was taken out on this home.
Original Mortgage
$450,000
Outstanding Balance
$310,546
Interest Rate
3.74%
Mortgage Type
New Conventional
Estimated Equity
$973,135
Purchase Details
Closed on
Aug 1, 2005
Sold by
Lutfiye Danielle Dulber As Sole Surviving Heir and Of Abdullah Dulber
Bought by
Dulber Neruse
Purchase Details
Closed on
Feb 17, 2005
Sold by
Dulber Neruse
Bought by
Dulber Abdullah
Purchase Details
Closed on
Mar 30, 2004
Sold by
Dulber Abdullah
Bought by
Dulber Neruse
Purchase Details
Closed on
Jul 29, 1998
Sold by
Nacmias Richard
Bought by
Dulber Abdullah
Create a Home Valuation Report for This Property
The Home Valuation Report is an in-depth analysis detailing your home's value as well as a comparison with similar homes in the area
Home Values in the Area
Average Home Value in this Area
Purchase History
| Date | Buyer | Sale Price | Title Company |
|---|---|---|---|
| Auguste Vladimir | $600,000 | -- | |
| Auguste Vladimir | $600,000 | -- | |
| Dulber Neruse | $350,000 | -- | |
| Dulber Neruse | $350,000 | -- | |
| Dulber Abdullah | -- | -- | |
| Dulber Abdullah | -- | -- | |
| Dulber Neruse | -- | -- | |
| Dulber Neruse | -- | -- | |
| Dulber Abdullah | $345,000 | Old Republic Natl Title Ins | |
| Dulber Abdullah | $345,000 | Old Republic Natl Title Ins |
Source: Public Records
Mortgage History
| Date | Status | Borrower | Loan Amount |
|---|---|---|---|
| Open | Auguste Vladimir | $450,000 | |
| Closed | Auguste Vladimir | $450,000 | |
| Closed | Dulber Abdullah | $0 |
Source: Public Records
Tax History
| Year | Tax Paid | Tax Assessment Tax Assessment Total Assessment is a certain percentage of the fair market value that is determined by local assessors to be the total taxable value of land and additions on the property. | Land | Improvement |
|---|---|---|---|---|
| 2025 | $10,377 | $52,620 | $16,680 | $35,940 |
| 2024 | $10,377 | $61,920 | $16,680 | $45,240 |
| 2023 | $10,414 | $75,960 | $16,680 | $59,280 |
| 2022 | $9,657 | $71,280 | $16,680 | $54,600 |
| 2021 | $9,605 | $67,380 | $16,680 | $50,700 |
| 2020 | $4,504 | $56,340 | $16,680 | $39,660 |
| 2019 | $9,007 | $48,960 | $16,680 | $32,280 |
| 2018 | $8,711 | $42,731 | $11,773 | $30,958 |
| 2017 | $8,218 | $40,313 | $15,310 | $25,003 |
| 2016 | $7,603 | $38,032 | $13,101 | $24,931 |
| 2015 | $16,046 | $35,880 | $18,540 | $17,340 |
| 2014 | $16,046 | $46,980 | $45,075 | $1,905 |
Source: Public Records
Map
Nearby Homes
- 1253 E 70th St
- 1241 E 69th St
- 1241 E 69 St
- 1250 E 69th St
- 1275 E 72nd St
- 6633 Avenue M
- 1384 E 70th St
- 24 Bergen Beach Place
- 1229 E 66th St
- 48 Bergen Beach Place
- 1132 E 72nd St
- 50 Bergen Beach Place
- 1208 Bergen Ave
- 1424 E 71st St
- 1438 E 70th St
- 1325 E 65th St
- 1372 E 66th St
- 1339 E 65th St
- 1215 E 59th St
- 1127 E 73rd St
- 1259 E 69th St
- 1265 E 69th St
- 1257 E 69th St
- 1269 E 69th St
- 1271 E 69th St
- 1253 E 69th St
- 1253 E 69th St Unit 1Fl
- 1275 E 69th St
- 1251 E 69th St
- 1266 E 70th St
- 1262 E 70th St
- 1268 E 70th St
- 1247 E 69th St
- 1247 E 69th St Unit 2
- 1277 E 69th St
- 1260 E 70th St
- 1272 E 70th St
- 1256 E 70th St
- 1274 E 70th St
- 1245 E 69th St
Your Personal Tour Guide
Ask me questions while you tour the home.