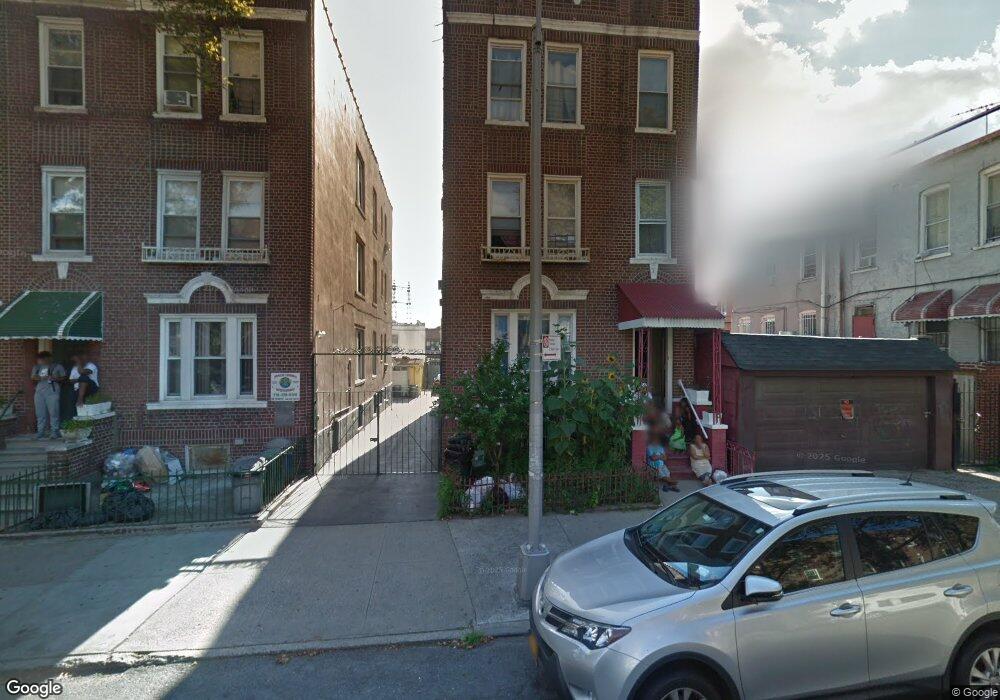
1263 Wheeler Ave Bronx, NY 10472
Parkchester NeighborhoodEstimated Value: $1,030,000 - $1,154,000
--
Bed
--
Bath
3,600
Sq Ft
$303/Sq Ft
Est. Value
About This Home
This home is located at 1263 Wheeler Ave, Bronx, NY 10472 and is currently estimated at $1,092,000, approximately $303 per square foot. 1263 Wheeler Ave is a home located in Bronx County with nearby schools including P.S. 195, P.S. 196, and P.S. 214.
Ownership History
Date
Name
Owned For
Owner Type
Purchase Details
Closed on
Jun 2, 2004
Sold by
Kutayiah Rabindra and Kutayiah Rajcumari
Bought by
Kutayiah Rajcumari and Kutayiah Rohan P
Current Estimated Value
Purchase Details
Closed on
Sep 26, 1995
Sold by
Umwattee Chandrika Matadeen and Umwattee Chandrika
Bought by
Kutayiah Rohan P and Kutayiah Rabindra
Home Financials for this Owner
Home Financials are based on the most recent Mortgage that was taken out on this home.
Original Mortgage
$180,000
Interest Rate
7.58%
Purchase Details
Closed on
Jun 27, 1995
Sold by
Mann Myrtle and Thompson Gladys
Bought by
Umwattee Chandrika Matadeen and Umwattee Chandrika
Home Financials for this Owner
Home Financials are based on the most recent Mortgage that was taken out on this home.
Original Mortgage
$134,400
Interest Rate
7.49%
Create a Home Valuation Report for This Property
The Home Valuation Report is an in-depth analysis detailing your home's value as well as a comparison with similar homes in the area
Home Values in the Area
Average Home Value in this Area
Purchase History
| Date | Buyer | Sale Price | Title Company |
|---|---|---|---|
| Kutayiah Rajcumari | -- | -- | |
| Kutayiah Rajcumari | -- | -- | |
| Kutayiah Rohan P | $202,000 | -- | |
| Kutayiah Rohan P | $202,000 | -- | |
| Umwattee Chandrika Matadeen | $168,000 | Commonwealth Land Title Ins | |
| Chandrika Matadeen | $168,000 | Commonwealth Land Title Ins |
Source: Public Records
Mortgage History
| Date | Status | Borrower | Loan Amount |
|---|---|---|---|
| Closed | Kutayiah Rohan P | $180,000 | |
| Previous Owner | Chandrika Matadeen | $134,400 |
Source: Public Records
Tax History Compared to Growth
Tax History
| Year | Tax Paid | Tax Assessment Tax Assessment Total Assessment is a certain percentage of the fair market value that is determined by local assessors to be the total taxable value of land and additions on the property. | Land | Improvement |
|---|---|---|---|---|
| 2025 | $7,159 | $37,325 | $6,943 | $30,382 |
| 2024 | $7,159 | $37,044 | $7,659 | $29,385 |
| 2023 | $6,813 | $34,948 | $6,705 | $28,243 |
| 2022 | $6,295 | $54,360 | $9,900 | $44,460 |
| 2021 | $6,243 | $44,520 | $9,900 | $34,620 |
| 2020 | $6,288 | $45,660 | $9,900 | $35,760 |
| 2019 | $6,165 | $38,640 | $9,900 | $28,740 |
| 2018 | $5,639 | $29,123 | $6,904 | $22,219 |
| 2017 | $5,301 | $27,475 | $7,776 | $19,699 |
| 2016 | $4,872 | $25,920 | $9,900 | $16,020 |
| 2015 | $3,055 | $27,169 | $10,504 | $16,665 |
| 2014 | $3,055 | $26,520 | $8,710 | $17,810 |
Source: Public Records
Map
Nearby Homes
- 1506 E 172nd St
- 1333 Bronx River Ave
- 1265 Elder Ave
- 1330 Elder Ave
- 1349 Elder Ave
- 1238 Colgate Ave
- 1495 Longfellow Ave
- 1244 Stratford Ave
- 1670 Longfellow Ave Unit 6J
- 1670 Longfellow Ave Unit 4A
- 1670 Longfellow Ave Unit 3J
- 1567 Longfellow Ave
- 1518 Bryant Ave
- 1552 Bryant Ave
- 1568 Bryant Ave
- 1456 Bryant Ave
- 1485 Bryant Ave
- 1636 E 172nd St
- 1128 Ward Ave
- 1126 Ward Ave
- 1261 Wheeler Ave
- 1259 Wheeler Ave
- 1496 E 172nd St
- 1498 E 172nd St
- 1257 Wheeler Ave
- 1494 E 172nd St
- 1492 E 172nd St
- 1262 Evergreen Ave
- 1255 Wheeler Ave
- 1260 Evergreen Ave
- 1264 Evergreen Ave
- 1258 Evergreen Ave
- 1266 Evergreen Ave
- 1256 Evergreen Ave
- 1253 Wheeler Ave
- 1500 E 172nd St
- 1490 E 172nd St
- 1254 Evergreen Ave
- 1268 Evergreen Ave
- 1251 Wheeler Ave