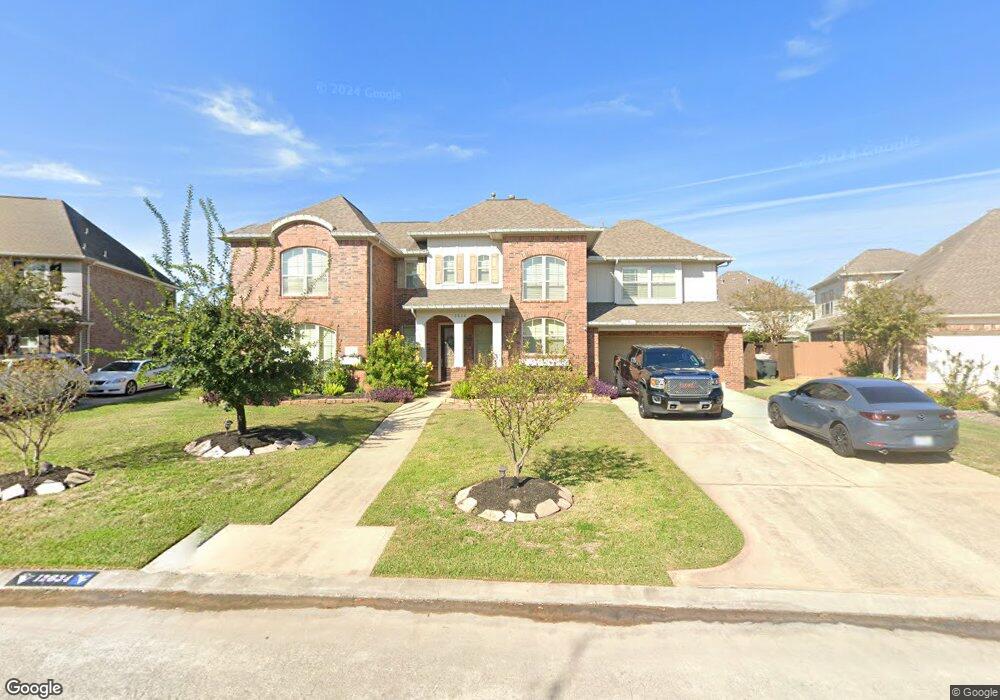
12634 Willow Breeze Dr Tomball, TX 77377
Northpointe NeighborhoodEstimated Value: $533,000 - $568,909
4
Beds
4
Baths
3,506
Sq Ft
$157/Sq Ft
Est. Value
About This Home
This home is located at 12634 Willow Breeze Dr, Tomball, TX 77377 and is currently estimated at $548,727, approximately $156 per square foot. 12634 Willow Breeze Dr is a home located in Harris County with nearby schools including Willow Creek Elementary School, Northpointe Intermediate School, and Willow Wood Junior High School.
Ownership History
Date
Name
Owned For
Owner Type
Purchase Details
Closed on
Apr 27, 2017
Sold by
Delost Anthony Paul and Delost Beverly Kay
Bought by
Mathews Stephen W and Mathews Dusty M
Current Estimated Value
Home Financials for this Owner
Home Financials are based on the most recent Mortgage that was taken out on this home.
Original Mortgage
$311,000
Outstanding Balance
$260,041
Interest Rate
4.3%
Mortgage Type
New Conventional
Estimated Equity
$288,686
Purchase Details
Closed on
Sep 1, 2005
Sold by
David Powers Homes S T Ltd
Bought by
Delost Anthony Paul and Delost Beverly Kay
Home Financials for this Owner
Home Financials are based on the most recent Mortgage that was taken out on this home.
Original Mortgage
$219,900
Interest Rate
5.78%
Mortgage Type
Fannie Mae Freddie Mac
Create a Home Valuation Report for This Property
The Home Valuation Report is an in-depth analysis detailing your home's value as well as a comparison with similar homes in the area
Home Values in the Area
Average Home Value in this Area
Purchase History
| Date | Buyer | Sale Price | Title Company |
|---|---|---|---|
| Mathews Stephen W | -- | First American Title | |
| Delost Anthony Paul | -- | Powers Title |
Source: Public Records
Mortgage History
| Date | Status | Borrower | Loan Amount |
|---|---|---|---|
| Open | Mathews Stephen W | $311,000 | |
| Previous Owner | Delost Anthony Paul | $219,900 |
Source: Public Records
Tax History Compared to Growth
Tax History
| Year | Tax Paid | Tax Assessment Tax Assessment Total Assessment is a certain percentage of the fair market value that is determined by local assessors to be the total taxable value of land and additions on the property. | Land | Improvement |
|---|---|---|---|---|
| 2025 | $11,297 | $542,758 | $85,756 | $457,002 |
| 2024 | $11,297 | $536,311 | $80,902 | $455,409 |
| 2023 | $11,297 | $544,384 | $72,812 | $471,572 |
| 2022 | $11,264 | $476,619 | $64,722 | $411,897 |
| 2021 | $10,612 | $404,691 | $52,586 | $352,105 |
| 2020 | $10,005 | $350,000 | $52,586 | $297,414 |
| 2019 | $10,177 | $346,318 | $48,145 | $298,173 |
| 2018 | $4,339 | $348,777 | $48,145 | $300,632 |
| 2017 | $10,299 | $348,777 | $48,145 | $300,632 |
| 2016 | $10,299 | $348,777 | $48,145 | $300,632 |
| 2015 | $8,052 | $331,403 | $48,145 | $283,258 |
| 2014 | $8,052 | $296,536 | $48,145 | $248,391 |
Source: Public Records
Map
Nearby Homes
- 12802 Mossy Ledge Dr
- 12806 Wandering Streams Dr
- 17623 Edengrove Dr
- 12611 Wandering Streams Dr
- 12823 Mossy Ledge Dr
- 12902 Frontier Creek Ct
- 12703 Songhollow Dr
- 12730 Holsberry Ct
- 12506 Opal Valley Dr
- 13018 Hazelwood Hollow Dr
- 18218 Russett Green Dr
- 12327 Northpointe Ridge Ln
- 17302 Holsberry Ct
- 19307 Hillside Pasture Ln
- 20618 Yearling Pasture Ln
- 19243 Palfrey Prairie Trail
- 19219 Palfrey Prairie Trail
- 19326 Palfrey Prairie Trail
- 18402 Sierra Falls Ct
- 18603 Bridle Grove Ct
- 12638 Willow Breeze Dr
- 12630 Willow Breeze Dr
- 12635 Midland Creek Dr
- 17603 Edengrove Dr
- 12626 Willow Breeze Dr
- 12702 Mossy Ledge Dr
- 12627 Midland Creek Dr
- 17527 Warm Winds Dr
- 12622 Willow Breeze Dr
- 12703 Sienna Trails Dr
- 17607 Edengrove Dr
- 12714 Mossy Ledge Dr
- 12626 Mossy Ledge Dr
- 12623 Midland Creek Dr
- 12707 Sienna Trails Dr
- 12707 Mossy Ledge Dr
- 12618 Willow Breeze Dr
- 12703 Mossy Ledge Dr
- 17610 Edengrove Dr
- 17611 Edengrove Dr