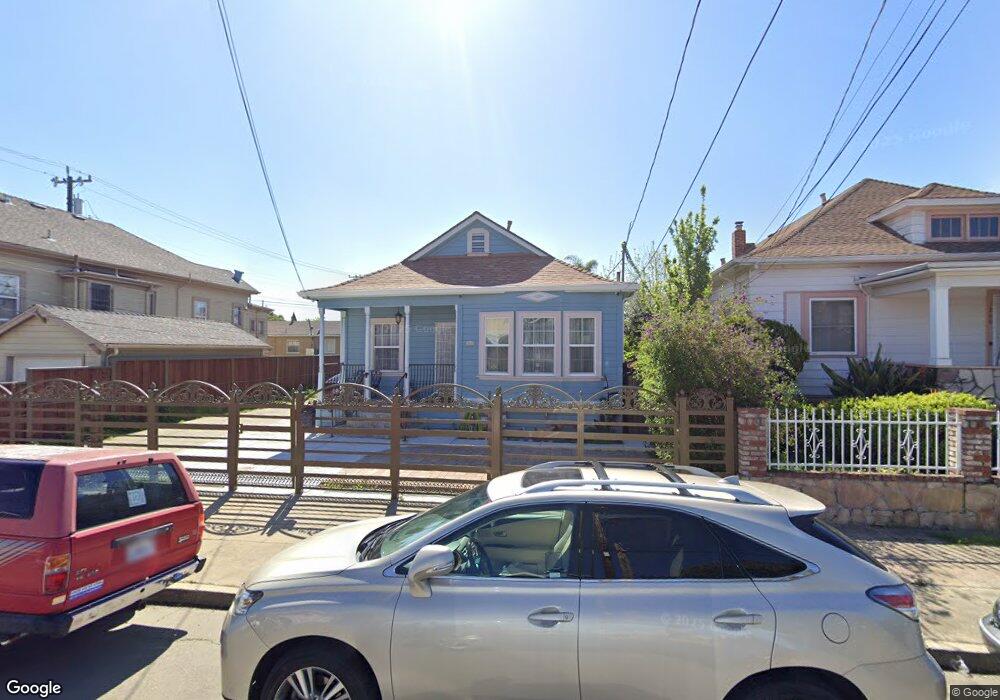
1264 96th Ave Oakland, CA 94603
Elmhurst Park NeighborhoodEstimated Value: $519,000 - $746,549
4
Beds
3
Baths
2,260
Sq Ft
$280/Sq Ft
Est. Value
About This Home
This home is located at 1264 96th Ave, Oakland, CA 94603 and is currently estimated at $632,183, approximately $279 per square foot. 1264 96th Ave is a home located in Alameda County with nearby schools including Fred T. Korematsu Discovery Academy, Esperanza Elementary School, and Elmhurst United Middle School.
Ownership History
Date
Name
Owned For
Owner Type
Purchase Details
Closed on
Dec 28, 2024
Sold by
Reyes Lorena B and Vaca Patrick
Bought by
Vaca Patrick and Buenrostro Adriana L
Current Estimated Value
Home Financials for this Owner
Home Financials are based on the most recent Mortgage that was taken out on this home.
Original Mortgage
$452,000
Outstanding Balance
$448,861
Interest Rate
6.81%
Mortgage Type
New Conventional
Estimated Equity
$183,322
Purchase Details
Closed on
Jul 7, 1997
Sold by
Aguilar Jose O and Solorzano Olga
Bought by
Vaca Patrick and Reyes Lorena B
Home Financials for this Owner
Home Financials are based on the most recent Mortgage that was taken out on this home.
Original Mortgage
$129,908
Interest Rate
7.93%
Mortgage Type
FHA
Create a Home Valuation Report for This Property
The Home Valuation Report is an in-depth analysis detailing your home's value as well as a comparison with similar homes in the area
Home Values in the Area
Average Home Value in this Area
Purchase History
| Date | Buyer | Sale Price | Title Company |
|---|---|---|---|
| Vaca Patrick | -- | Mortgage Connect | |
| Vaca Patrick | $130,000 | Fidelity National Title Co |
Source: Public Records
Mortgage History
| Date | Status | Borrower | Loan Amount |
|---|---|---|---|
| Open | Vaca Patrick | $452,000 | |
| Previous Owner | Vaca Patrick | $129,908 |
Source: Public Records
Tax History Compared to Growth
Tax History
| Year | Tax Paid | Tax Assessment Tax Assessment Total Assessment is a certain percentage of the fair market value that is determined by local assessors to be the total taxable value of land and additions on the property. | Land | Improvement |
|---|---|---|---|---|
| 2025 | $5,283 | $229,513 | $62,270 | $167,243 |
| 2024 | $5,283 | $225,014 | $61,049 | $163,965 |
| 2023 | $5,399 | $220,602 | $59,852 | $160,750 |
| 2022 | $5,125 | $216,277 | $58,679 | $157,598 |
| 2021 | $4,713 | $212,036 | $57,528 | $154,508 |
| 2020 | $4,656 | $209,863 | $56,938 | $152,925 |
| 2019 | $4,362 | $205,749 | $55,822 | $149,927 |
| 2018 | $4,271 | $201,716 | $54,728 | $146,988 |
| 2017 | $4,060 | $197,761 | $53,655 | $144,106 |
| 2016 | $3,861 | $193,884 | $52,603 | $141,281 |
| 2015 | $3,835 | $190,972 | $51,813 | $139,159 |
| 2014 | $3,920 | $187,231 | $50,798 | $136,433 |
Source: Public Records
Map
Nearby Homes