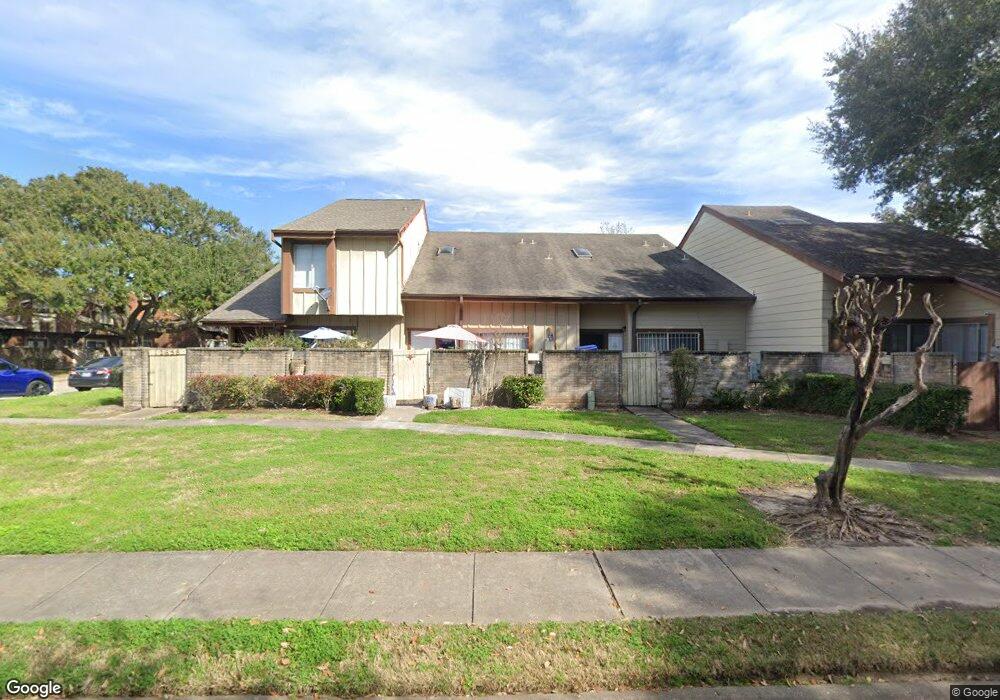
12644 Newbrook Dr Unit 501 Houston, TX 77072
Alief NeighborhoodEstimated Value: $128,502 - $148,000
2
Beds
1
Bath
797
Sq Ft
$168/Sq Ft
Est. Value
About This Home
This home is located at 12644 Newbrook Dr Unit 501, Houston, TX 77072 and is currently estimated at $133,876, approximately $167 per square foot. 12644 Newbrook Dr Unit 501 is a home located in Harris County with nearby schools including Alexander Elementary School, Youngblood Intermediate School, and Holub Middle School.
Ownership History
Date
Name
Owned For
Owner Type
Purchase Details
Closed on
Feb 21, 2014
Sold by
Secretary Of Housing And Urban Develo
Bought by
Perez Maria G and Perez Everardo
Current Estimated Value
Purchase Details
Closed on
Aug 15, 2013
Sold by
Wells Fargo Bank Na
Bought by
The Secretary Of Hud
Purchase Details
Closed on
Sep 3, 2008
Sold by
Kirby Dorothy G
Bought by
Wells Fargo Bank Na
Home Financials for this Owner
Home Financials are based on the most recent Mortgage that was taken out on this home.
Original Mortgage
$39,086
Interest Rate
6.6%
Mortgage Type
FHA
Purchase Details
Closed on
Dec 20, 2002
Sold by
Yarbrough Ray Abraham
Bought by
Nguyen Trang Ngoc
Home Financials for this Owner
Home Financials are based on the most recent Mortgage that was taken out on this home.
Original Mortgage
$54,500
Interest Rate
5.75%
Create a Home Valuation Report for This Property
The Home Valuation Report is an in-depth analysis detailing your home's value as well as a comparison with similar homes in the area
Home Values in the Area
Average Home Value in this Area
Purchase History
| Date | Buyer | Sale Price | Title Company |
|---|---|---|---|
| Perez Maria G | -- | -- | |
| Perez Maria G | -- | -- | |
| The Secretary Of Hud | -- | None Available | |
| Wells Fargo Bank Na | $37,350 | None Available | |
| Kirby Dorothy G | -- | Infinity Title Company | |
| Nguyen Trang Ngoc | -- | Chicago Title Insurance Co |
Source: Public Records
Mortgage History
| Date | Status | Borrower | Loan Amount |
|---|---|---|---|
| Previous Owner | Kirby Dorothy G | $39,086 | |
| Previous Owner | Nguyen Trang Ngoc | $54,500 |
Source: Public Records
Tax History Compared to Growth
Tax History
| Year | Tax Paid | Tax Assessment Tax Assessment Total Assessment is a certain percentage of the fair market value that is determined by local assessors to be the total taxable value of land and additions on the property. | Land | Improvement |
|---|---|---|---|---|
| 2025 | -- | $133,453 | $37,884 | $95,569 |
| 2024 | -- | $135,222 | $37,884 | $97,338 |
| 2023 | $2,457 | $136,992 | $37,884 | $99,108 |
| 2022 | $2,426 | $111,589 | $30,307 | $81,282 |
| 2021 | $2,219 | $90,913 | $22,730 | $68,183 |
| 2020 | $2,214 | $87,561 | $22,730 | $64,831 |
| 2019 | $2,153 | $78,199 | $16,101 | $62,098 |
| 2018 | $967 | $72,677 | $13,259 | $59,418 |
| 2017 | $1,982 | $72,677 | $13,259 | $59,418 |
| 2016 | $1,680 | $61,610 | $13,259 | $48,351 |
| 2015 | $1,156 | $50,294 | $13,259 | $37,035 |
| 2014 | $1,156 | $43,543 | $13,259 | $30,284 |
Source: Public Records
Map
Nearby Homes
- 12632 Newbrook Dr
- 12581 Wellington Park Dr
- 12606 Newbrook Dr
- 12605 Wellington Park Dr Unit 17
- 12668 Newbrook Dr Unit 495
- 12543 Wellington Park Dr
- 12682 Newbrook Dr
- 12552 Newbrook Dr
- 12525 Wellington Park Dr
- 8532 Dairy View Ln
- 8612 Dairy View Ln
- 12522 Lima Dr
- 12712 Plummersville St
- 8494 Dairy View Ln
- 12722 Yoshino Cherry St
- 8907 S Dairy Ashford Rd
- 12510 Shannon Hills Dr
- 12420 Newbrook Dr
- 12431 Bexley Dr
- 12627 Ashford Shore Dr
- 12644 Newbrook Dr
- 12646 Newbrook Dr
- 12646 Newbrook Dr Unit 502
- 12648 Newbrook Dr
- 12650 Newbrook Dr
- 12614 Newbrook Dr Unit 197
- 12616 Newbrook Dr
- 12636 Newbrook Dr
- 12636 Newbrook Dr Unit 474
- 12612 Newbrook Dr
- 12610 Newbrook Dr
- 12652 Newbrook Dr
- 12654 Newbrook Dr
- 12638 Newbrook Dr
- 12638 Newbrook Dr Unit 473
- 12618 Newbrook Dr
- 12656 Newbrook Dr
- 12608 Newbrook Dr
- 12608 Newbrook Dr Unit 194
- 12640 Wellington Park Unit 47