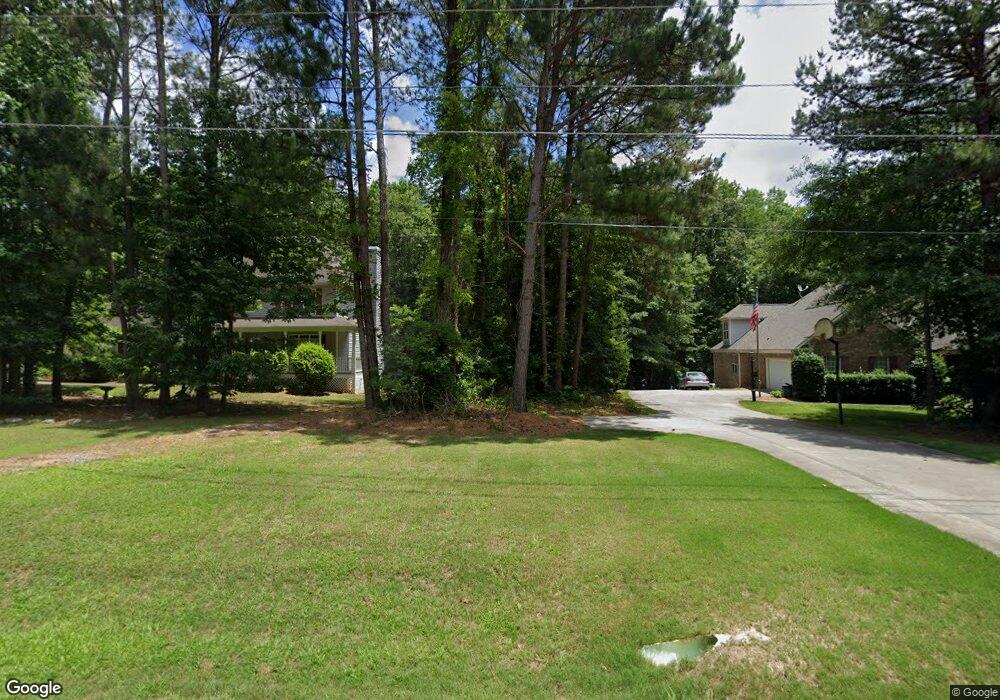
12644 Panhandle Rd Hampton, GA 30228
Estimated Value: $281,000 - $362,000
4
Beds
3
Baths
2,450
Sq Ft
$126/Sq Ft
Est. Value
About This Home
This home is located at 12644 Panhandle Rd, Hampton, GA 30228 and is currently estimated at $309,653, approximately $126 per square foot. 12644 Panhandle Rd is a home located in Clayton County with nearby schools including River's Edge Elementary School, Eddie White Academy, and Lovejoy High School.
Ownership History
Date
Name
Owned For
Owner Type
Purchase Details
Closed on
Dec 5, 2014
Sold by
Carl Mark W
Bought by
Shipe Gregory L and Shipe Lillian June
Current Estimated Value
Home Financials for this Owner
Home Financials are based on the most recent Mortgage that was taken out on this home.
Original Mortgage
$87,000
Outstanding Balance
$66,874
Interest Rate
4.25%
Mortgage Type
New Conventional
Estimated Equity
$242,779
Purchase Details
Closed on
Jul 30, 1999
Sold by
Beta Const Inc
Bought by
Carl Mark W and Carl Rebecca E
Home Financials for this Owner
Home Financials are based on the most recent Mortgage that was taken out on this home.
Original Mortgage
$148,000
Interest Rate
7.7%
Mortgage Type
New Conventional
Create a Home Valuation Report for This Property
The Home Valuation Report is an in-depth analysis detailing your home's value as well as a comparison with similar homes in the area
Home Values in the Area
Average Home Value in this Area
Purchase History
| Date | Buyer | Sale Price | Title Company |
|---|---|---|---|
| Shipe Gregory L | $124,900 | -- | |
| Carl Mark W | $185,000 | -- |
Source: Public Records
Mortgage History
| Date | Status | Borrower | Loan Amount |
|---|---|---|---|
| Open | Shipe Gregory L | $87,000 | |
| Previous Owner | Carl Mark W | $148,000 | |
| Previous Owner | Carl Mark W | $18,500 |
Source: Public Records
Tax History
| Year | Tax Paid | Tax Assessment Tax Assessment Total Assessment is a certain percentage of the fair market value that is determined by local assessors to be the total taxable value of land and additions on the property. | Land | Improvement |
|---|---|---|---|---|
| 2025 | $2,204 | $129,480 | $10,400 | $119,080 |
| 2024 | $2,388 | $134,680 | $10,400 | $124,280 |
| 2023 | $3,974 | $131,800 | $10,400 | $121,400 |
| 2022 | $4,315 | $108,800 | $10,400 | $98,400 |
| 2021 | $3,274 | $81,760 | $10,400 | $71,360 |
| 2020 | $3,280 | $80,874 | $10,400 | $70,474 |
| 2019 | $3,255 | $79,067 | $10,400 | $68,667 |
| 2018 | $3,142 | $76,282 | $10,400 | $65,882 |
| 2017 | $2,794 | $67,559 | $10,400 | $57,159 |
| 2016 | $2,370 | $57,129 | $10,400 | $46,729 |
| 2015 | $2,044 | $0 | $0 | $0 |
| 2014 | $2,010 | $49,387 | $10,400 | $38,987 |
Source: Public Records
Map
Nearby Homes
- 0 Panhandle Rd Unit LOT 1 10559919
- 0 Panhandle Rd Unit LOT 4 10559933
- 0 Panhandle Rd Unit LOT 3 10559926
- 644 Hampton Rd
- 12359 Hillcrest Dr
- 12328 Edgewater Dr
- 424 Hampton Rd
- 12275 Styron Dr
- 12283 Coldstream Ct
- 829 Sweden Forest Cove
- 12148 Flannery Ln
- 526 Canady Ct
- 12237 Dickson Rd Unit 1
- 12123 Edgewater Dr
- 12140 Dominion Dr
- 11961 Markham Way
- 12095 Panhandle Rd
- 12090 Centerra Dr
- 1083 Hampton Rd
- 12149 Centerra Dr
- 12632 Panhandle Rd
- 12660 Panhandle Rd
- 12620 Panhandle Rd
- 718 Lake Cove Dr
- 12674 Panhandle Rd
- 706 Lake Cove Dr
- 12608 Panhandle Rd
- 12686 Panhandle Rd
- 694 Lake Cove Dr
- 709 Lake Cove Dr
- 811 Zeiler Ct
- 12596 Panhandle Rd
- 721 Lake Cove Dr
- 682 Lake Cove Dr
- 820 Justin Ct
- 819 Justin Ct
- 697 Lake Cove Dr
- 12698 Panhandle Rd
- 807 Zeiler Ct
- 828 Justin Ct
Your Personal Tour Guide
Ask me questions while you tour the home.