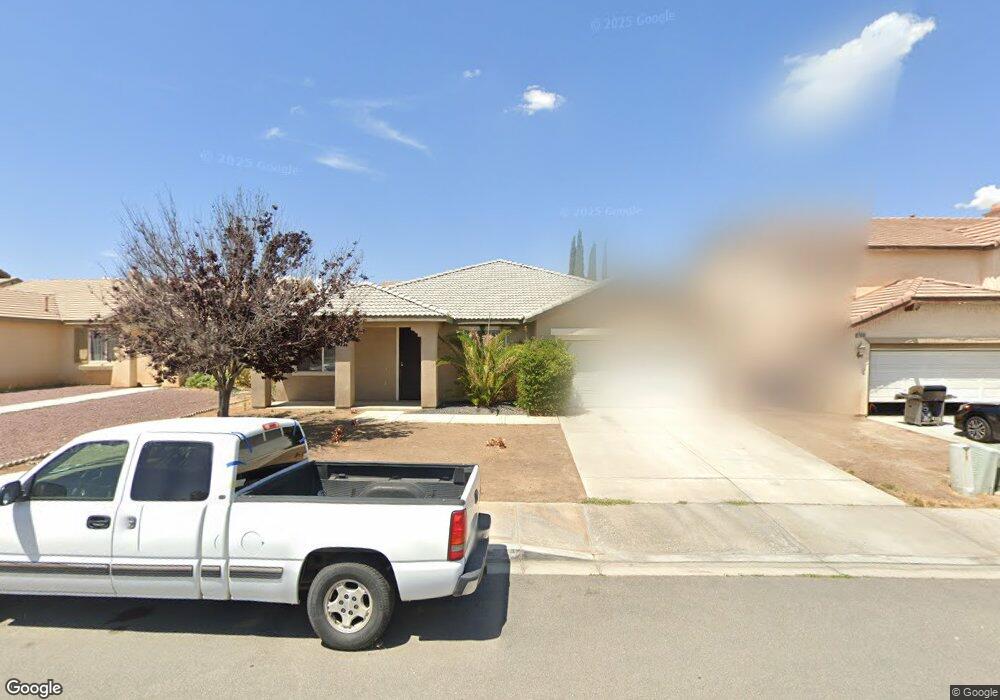
12644 Westbranch Way Victorville, CA 92392
Mesa Linda NeighborhoodEstimated Value: $437,868 - $501,000
4
Beds
2
Baths
2,314
Sq Ft
$204/Sq Ft
Est. Value
About This Home
This home is located at 12644 Westbranch Way, Victorville, CA 92392 and is currently estimated at $470,967, approximately $203 per square foot. 12644 Westbranch Way is a home located in San Bernardino County with nearby schools including Eagle Ranch Elementary School, Silverado High School, and Mojave River Academy - Oro Grande.
Ownership History
Date
Name
Owned For
Owner Type
Purchase Details
Closed on
Sep 29, 2021
Sold by
Liang Xuejun
Bought by
Liang Xuejun and Xuejun Liang Family Trust
Current Estimated Value
Purchase Details
Closed on
May 3, 2017
Sold by
Jordan Stephen W
Bought by
Liang Xuejun
Purchase Details
Closed on
Feb 17, 2009
Sold by
The Bank Of New York Mellon
Bought by
Jordan Stephen W and Jordan Sarah A
Home Financials for this Owner
Home Financials are based on the most recent Mortgage that was taken out on this home.
Original Mortgage
$137,464
Interest Rate
4.78%
Mortgage Type
FHA
Purchase Details
Closed on
Oct 30, 2008
Sold by
Marlar Shawn M
Bought by
The Bank Of New York
Purchase Details
Closed on
Jun 10, 2003
Sold by
Hyatt Pointe Llc
Bought by
Marlar Shawn M and Marlar Angela M
Home Financials for this Owner
Home Financials are based on the most recent Mortgage that was taken out on this home.
Original Mortgage
$198,331
Interest Rate
5.17%
Mortgage Type
FHA
Create a Home Valuation Report for This Property
The Home Valuation Report is an in-depth analysis detailing your home's value as well as a comparison with similar homes in the area
Home Values in the Area
Average Home Value in this Area
Purchase History
| Date | Buyer | Sale Price | Title Company |
|---|---|---|---|
| Liang Xuejun | -- | None Available | |
| Liang Xuejun | $261,000 | Chicago Title Company | |
| Jordan Stephen W | $140,000 | Fnt | |
| The Bank Of New York | $222,102 | American Title | |
| Marlar Shawn M | $206,000 | First American |
Source: Public Records
Mortgage History
| Date | Status | Borrower | Loan Amount |
|---|---|---|---|
| Previous Owner | Jordan Stephen W | $137,464 | |
| Previous Owner | Marlar Shawn M | $198,331 |
Source: Public Records
Tax History Compared to Growth
Tax History
| Year | Tax Paid | Tax Assessment Tax Assessment Total Assessment is a certain percentage of the fair market value that is determined by local assessors to be the total taxable value of land and additions on the property. | Land | Improvement |
|---|---|---|---|---|
| 2025 | $3,567 | $302,915 | $60,583 | $242,332 |
| 2024 | $3,567 | $296,975 | $59,395 | $237,580 |
| 2023 | $3,532 | $291,152 | $58,230 | $232,922 |
| 2022 | $3,467 | $285,443 | $57,088 | $228,355 |
| 2021 | $3,659 | $279,846 | $55,969 | $223,877 |
| 2020 | $3,593 | $276,976 | $55,395 | $221,581 |
| 2019 | $3,570 | $271,545 | $54,309 | $217,236 |
| 2018 | $3,607 | $266,220 | $53,244 | $212,976 |
| 2017 | $2,155 | $155,344 | $27,742 | $127,602 |
| 2016 | $1,970 | $152,298 | $27,198 | $125,100 |
| 2015 | $2,049 | $150,010 | $26,789 | $123,221 |
| 2014 | $2,029 | $147,071 | $26,264 | $120,807 |
Source: Public Records
Map
Nearby Homes
- 12776 Berrydale St
- 12766 Brookdale St
- 12862 Fencerider Way
- 12451 Antelope Dr
- 12413 Redrock Rd
- 12544 Sunbird Ln
- 12373 Albatross St
- 0 Cantina Dr Unit OC25239997
- 0 395 Hwy Unit HD24067189
- 0 Hwy 395 Unit HD24040654
- 0 395 Hwy Unit 542190
- 12960 Leawood St
- 0 El Dorado St Unit SR25115583
- 0 Highway 395 Unit HD25171127
- 0 Highway 395 Unit HD25120289
- 0 Highway 395 Unit CV24228214
- 12477 Redrock Ct
- 12312 Atoka Ln
- 12602 El Dorado Place
- 13039 Woodhill St
- 12634 Westbranch Way
- 12656 Westbranch Way
- 12653 Sunglow Ln
- 12663 Sunglow Ln
- 12668 Westbranch Way
- 12641 Sunglow Ln
- 12675 Sunglow Ln
- 12631 Sunglow Ln
- 12612 Westbranch Way
- 12676 Westbranch Way
- 12653 Westbranch Way
- 12631 Westbranch Way
- 12669 Westbranch Way
- 12621 Sunglow Ln
- 12617 Westbranch Way
- 12602 Westbranch Way
- 12695 Sunglow Ln
- 12658 Sunglow Ln
- 12688 Westbranch Way