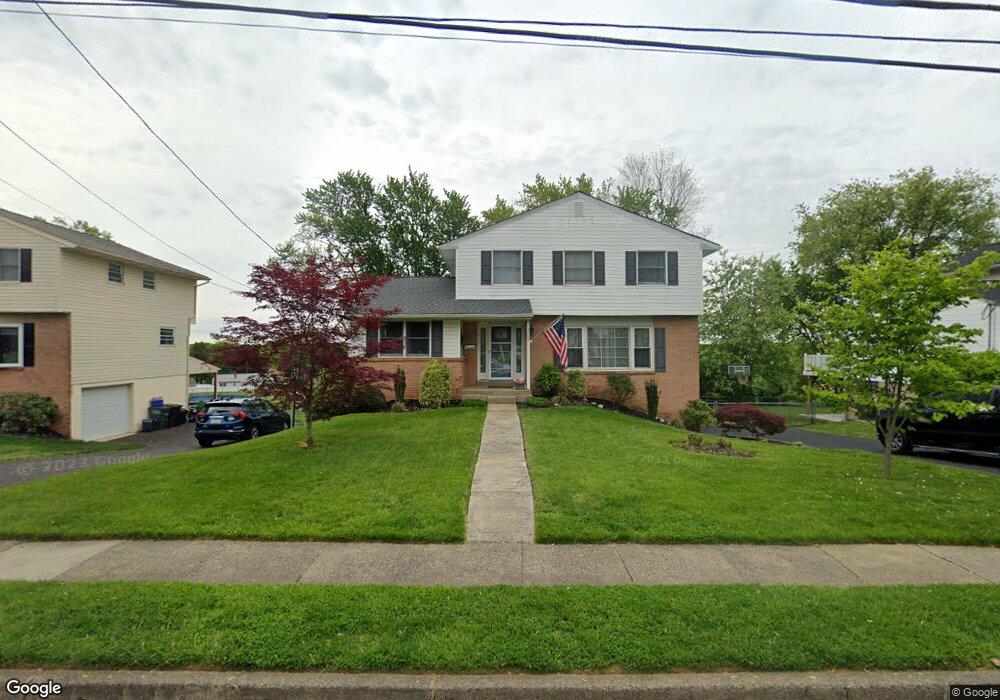
1265 Dennis Rd Southampton, PA 18966
Estimated Value: $492,000 - $549,000
3
Beds
2
Baths
1,844
Sq Ft
$277/Sq Ft
Est. Value
About This Home
This home is located at 1265 Dennis Rd, Southampton, PA 18966 and is currently estimated at $509,892, approximately $276 per square foot. 1265 Dennis Rd is a home located in Bucks County with nearby schools including Davis Elementary School, Klinger Middle School, and William Tennent High School.
Ownership History
Date
Name
Owned For
Owner Type
Purchase Details
Closed on
Aug 31, 2007
Sold by
Chang Chin Paek and Chang Won Im
Bought by
Dunne Sean E and Tacey Jessica
Current Estimated Value
Home Financials for this Owner
Home Financials are based on the most recent Mortgage that was taken out on this home.
Original Mortgage
$349,900
Interest Rate
6.75%
Mortgage Type
Purchase Money Mortgage
Purchase Details
Closed on
Sep 6, 1979
Bought by
Chang Chin Paek and Won Im
Create a Home Valuation Report for This Property
The Home Valuation Report is an in-depth analysis detailing your home's value as well as a comparison with similar homes in the area
Home Values in the Area
Average Home Value in this Area
Purchase History
| Date | Buyer | Sale Price | Title Company |
|---|---|---|---|
| Dunne Sean E | $349,900 | None Available | |
| Chang Chin Paek | $64,000 | -- |
Source: Public Records
Mortgage History
| Date | Status | Borrower | Loan Amount |
|---|---|---|---|
| Previous Owner | Dunne Sean E | $349,900 |
Source: Public Records
Tax History Compared to Growth
Tax History
| Year | Tax Paid | Tax Assessment Tax Assessment Total Assessment is a certain percentage of the fair market value that is determined by local assessors to be the total taxable value of land and additions on the property. | Land | Improvement |
|---|---|---|---|---|
| 2025 | $5,818 | $27,200 | $4,880 | $22,320 |
| 2024 | $5,818 | $27,200 | $4,880 | $22,320 |
| 2023 | $5,641 | $27,200 | $4,880 | $22,320 |
| 2022 | $5,522 | $27,200 | $4,880 | $22,320 |
| 2021 | $5,422 | $27,200 | $4,880 | $22,320 |
| 2020 | $5,348 | $27,200 | $4,880 | $22,320 |
| 2019 | $5,151 | $27,200 | $4,880 | $22,320 |
| 2018 | $5,032 | $27,200 | $4,880 | $22,320 |
| 2017 | $4,890 | $27,200 | $4,880 | $22,320 |
| 2016 | $4,890 | $27,200 | $4,880 | $22,320 |
| 2015 | -- | $27,200 | $4,880 | $22,320 |
| 2014 | -- | $27,200 | $4,880 | $22,320 |
Source: Public Records
Map
Nearby Homes