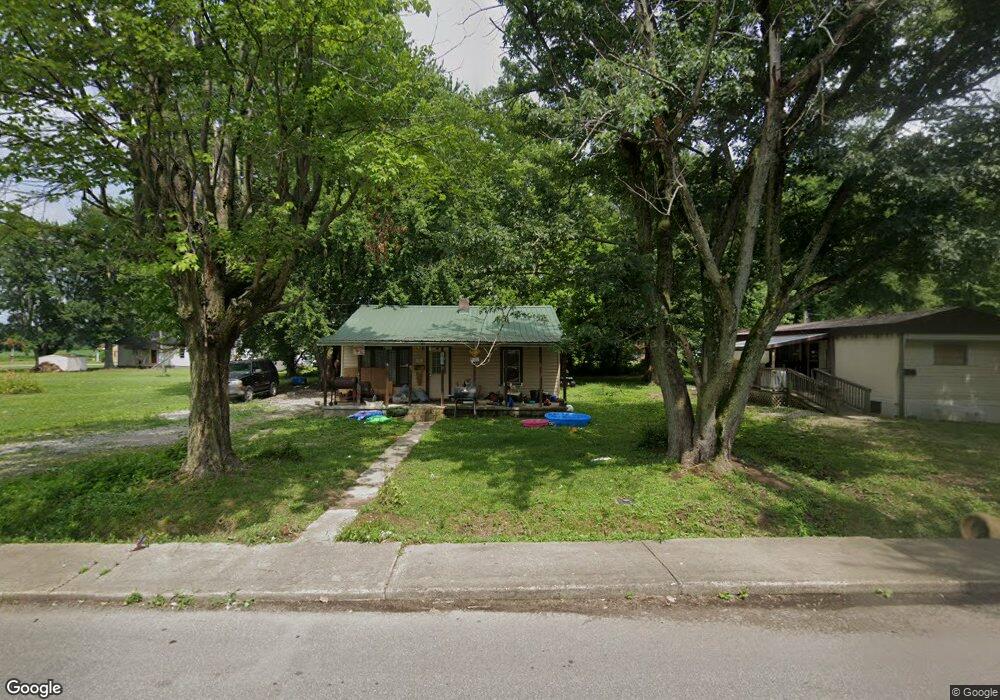
1265 Mann Ave Austin, IN 47102
Estimated Value: $106,817 - $155,000
3
Beds
1
Bath
1,064
Sq Ft
$121/Sq Ft
Est. Value
About This Home
This home is located at 1265 Mann Ave, Austin, IN 47102 and is currently estimated at $128,454, approximately $120 per square foot. 1265 Mann Ave is a home located in Scott County with nearby schools including Austin Elementary School, Austin Middle School, and Austin High School.
Ownership History
Date
Name
Owned For
Owner Type
Purchase Details
Closed on
Jul 3, 2024
Sold by
Estate Of Tex Murphy
Bought by
Henson Stephen Christopher
Current Estimated Value
Purchase Details
Closed on
Nov 29, 2021
Sold by
Murphy Joey
Bought by
Murphy Tex
Purchase Details
Closed on
Apr 13, 2018
Sold by
Murphy Tex
Bought by
Murphy Joey
Purchase Details
Closed on
Jan 24, 2017
Sold by
Johnson Tammy Stout
Bought by
Murphy Tex
Create a Home Valuation Report for This Property
The Home Valuation Report is an in-depth analysis detailing your home's value as well as a comparison with similar homes in the area
Home Values in the Area
Average Home Value in this Area
Purchase History
| Date | Buyer | Sale Price | Title Company |
|---|---|---|---|
| Henson Stephen Christopher | $40,000 | Houston, Thompson And Lewis Pc | |
| Murphy Tex | -- | None Available | |
| Murphy Joey | -- | None Available | |
| Murphy Tex | $9,000 | None Available |
Source: Public Records
Tax History Compared to Growth
Tax History
| Year | Tax Paid | Tax Assessment Tax Assessment Total Assessment is a certain percentage of the fair market value that is determined by local assessors to be the total taxable value of land and additions on the property. | Land | Improvement |
|---|---|---|---|---|
| 2024 | $626 | $24,900 | $8,100 | $16,800 |
| 2023 | $726 | $26,900 | $9,500 | $17,400 |
| 2022 | $588 | $26,000 | $9,500 | $16,500 |
| 2021 | $518 | $24,500 | $9,500 | $15,000 |
| 2020 | $501 | $24,500 | $9,500 | $15,000 |
| 2019 | $1,030 | $24,500 | $9,500 | $15,000 |
| 2018 | $522 | $25,500 | $9,500 | $16,000 |
| 2017 | $229 | $25,500 | $9,500 | $16,000 |
| 2016 | $281 | $30,200 | $9,500 | $20,700 |
| 2014 | $277 | $38,200 | $15,000 | $23,200 |
| 2013 | $277 | $39,200 | $15,000 | $24,200 |
Source: Public Records
Map
Nearby Homes