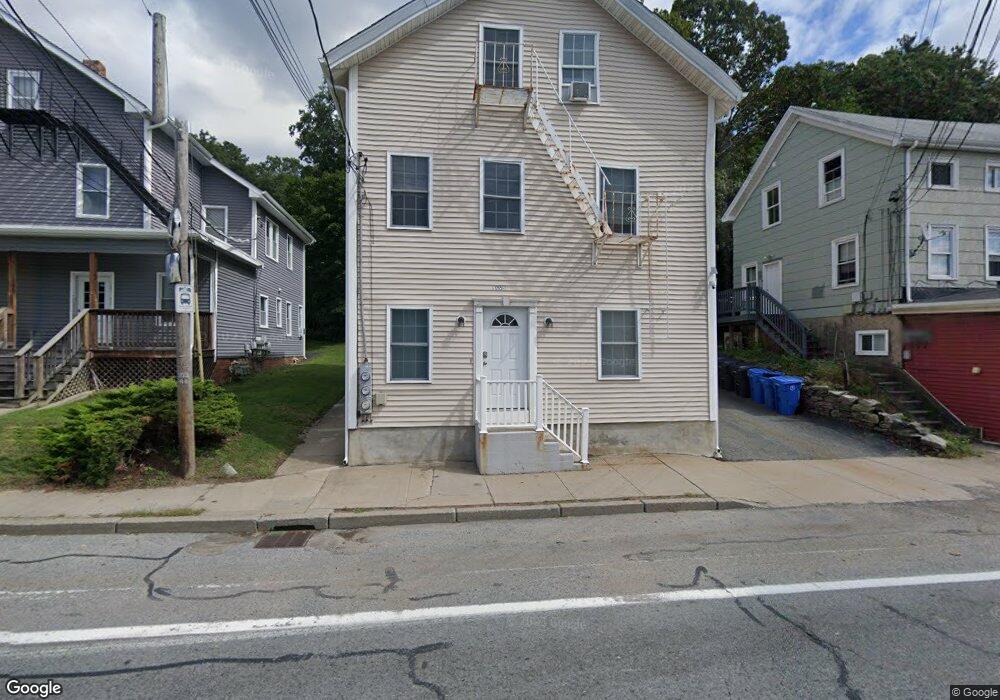
1265 Mendon Rd Cumberland, RI 02864
Ashton NeighborhoodEstimated Value: $478,083 - $653,000
6
Beds
3
Baths
3,264
Sq Ft
$178/Sq Ft
Est. Value
About This Home
This home is located at 1265 Mendon Rd, Cumberland, RI 02864 and is currently estimated at $581,021, approximately $178 per square foot. 1265 Mendon Rd is a home located in Providence County with nearby schools including Garvin Memorial School, Joseph L. McCourt Middle School, and Cumberland High School.
Ownership History
Date
Name
Owned For
Owner Type
Purchase Details
Closed on
Oct 15, 2010
Sold by
Dream Home Rlty
Bought by
Poirier Stephanie M
Current Estimated Value
Home Financials for this Owner
Home Financials are based on the most recent Mortgage that was taken out on this home.
Original Mortgage
$193,309
Outstanding Balance
$125,618
Interest Rate
4.36%
Mortgage Type
Purchase Money Mortgage
Estimated Equity
$455,403
Purchase Details
Closed on
Oct 6, 2010
Sold by
Fhlmc
Bought by
Dream Home Realty Llc
Home Financials for this Owner
Home Financials are based on the most recent Mortgage that was taken out on this home.
Original Mortgage
$193,309
Outstanding Balance
$125,618
Interest Rate
4.36%
Mortgage Type
Purchase Money Mortgage
Estimated Equity
$455,403
Purchase Details
Closed on
Sep 10, 2008
Sold by
Kelliher Malachy F
Bought by
Fhlmc
Purchase Details
Closed on
Jul 30, 2001
Sold by
Thornton Albert H and Thornton Keri Sue
Bought by
Kelliher Malachy F and Kelliher Constance M
Create a Home Valuation Report for This Property
The Home Valuation Report is an in-depth analysis detailing your home's value as well as a comparison with similar homes in the area
Home Values in the Area
Average Home Value in this Area
Purchase History
| Date | Buyer | Sale Price | Title Company |
|---|---|---|---|
| Poirier Stephanie M | $194,900 | -- | |
| Dream Home Realty Llc | $73,000 | -- | |
| Fhlmc | -- | -- | |
| Fhlmc | $162,300 | -- | |
| Kelliher Malachy F | $139,000 | -- |
Source: Public Records
Mortgage History
| Date | Status | Borrower | Loan Amount |
|---|---|---|---|
| Open | Kelliher Malachy F | $193,309 | |
| Closed | Kelliher Malachy F | $80,000 |
Source: Public Records
Tax History
| Year | Tax Paid | Tax Assessment Tax Assessment Total Assessment is a certain percentage of the fair market value that is determined by local assessors to be the total taxable value of land and additions on the property. | Land | Improvement |
|---|---|---|---|---|
| 2025 | $4,987 | $406,400 | $123,900 | $282,500 |
| 2024 | $4,856 | $406,400 | $123,900 | $282,500 |
| 2023 | $4,722 | $406,400 | $123,900 | $282,500 |
| 2022 | $3,993 | $266,400 | $86,700 | $179,700 |
| 2021 | $3,927 | $266,400 | $86,700 | $179,700 |
| 2020 | $3,815 | $266,400 | $86,700 | $179,700 |
| 2019 | $3,378 | $212,700 | $72,400 | $140,300 |
| 2018 | $3,280 | $212,700 | $72,400 | $140,300 |
| 2017 | $3,235 | $212,700 | $72,400 | $140,300 |
| 2016 | $2,958 | $173,200 | $63,800 | $109,400 |
| 2015 | $2,958 | $173,200 | $63,800 | $109,400 |
| 2014 | $2,958 | $173,200 | $63,800 | $109,400 |
| 2013 | $2,855 | $180,900 | $63,900 | $117,000 |
Source: Public Records
Map
Nearby Homes
- 1251 Mendon Rd
- 1 Barway Ln
- 3 Barrett St
- 7 Hidden Valley Ln
- 21 A St
- 200 Old Mendon Rd
- 107 Old River Rd Unit 11
- 34 Dexter Rock Rd
- 97 Angell Rd
- 461 River Rd
- 500 Mendon Rd Unit 320
- 1 Ashley Dr
- 1504 Hunting Hill Dr
- 1502 Hunting Hill Dr
- 1503 Hunting Hill Dr
- 1501 Hunting Hill Dr
- 8 Dorr St
- 8 Valentine Ct
- 0 Narragansett Rd
- 24 Narragansett Ave
- 1269 Mendon Rd
- 1269 Mendon Rd Unit 2
- 1269 Mendon Rd Unit 1
- 1269 Mendon Rd Unit 3
- 1255 Mendon Rd
- 1255 Mendon Rd Unit 2
- 1266 Mendon Rd
- 1262 Mendon Rd
- 1249 Mendon Rd
- 1285 Mendon Rd
- 1270 Mendon Rd
- 3 Ora Murphy Ct
- 3 Ora Murphy Ct Unit 3 Ora Murphy Ct. Rig
- 6 Ora Murphy Ct
- 6 Ora Murphy Ct Unit 1
- 1251 Mendon Rd Unit 2
- 1251 Mendon Rd Unit 1
- 2 Ora Murphy Ct Unit 1st Floor
- 2 Ora Murphy Ct
- 1250 Mendon Rd
Your Personal Tour Guide
Ask me questions while you tour the home.