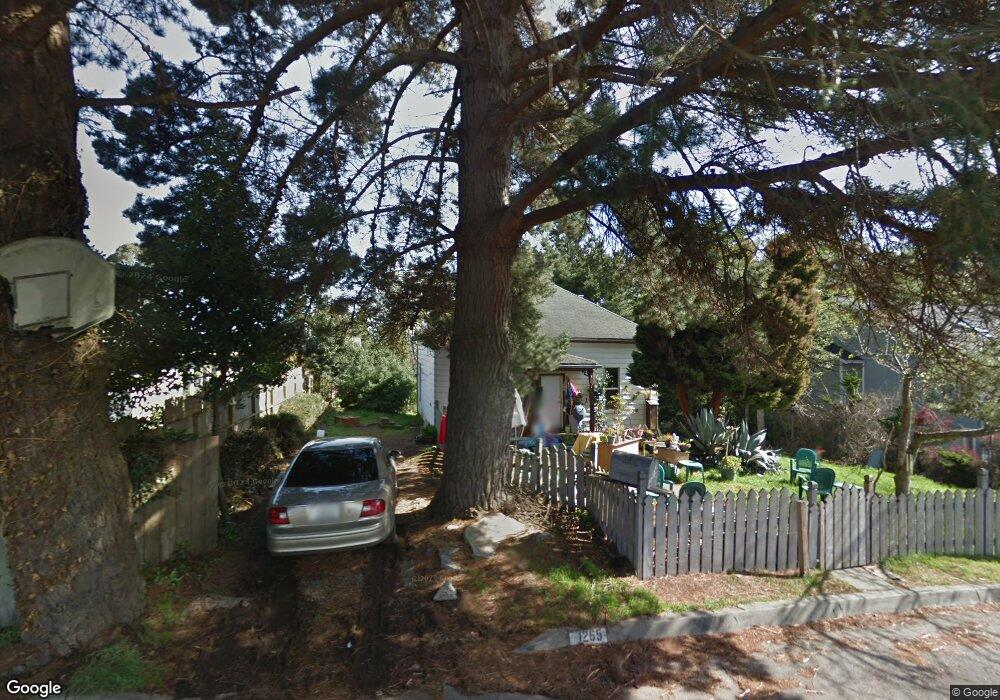
1265 Searles St Eureka, CA 95501
City Center NeighborhoodEstimated Value: $236,688 - $330,000
2
Beds
1
Bath
924
Sq Ft
$296/Sq Ft
Est. Value
About This Home
This home is located at 1265 Searles St, Eureka, CA 95501 and is currently estimated at $273,422, approximately $295 per square foot. 1265 Searles St is a home located in Humboldt County with nearby schools including Lafayette Elementary School, Catherine L. Zane Middle School, and Eureka Senior High School.
Ownership History
Date
Name
Owned For
Owner Type
Purchase Details
Closed on
Aug 18, 2020
Sold by
James D And Judith E Paye Revocable Trus and Paye James D
Bought by
Payes Investment Properties Llc
Current Estimated Value
Purchase Details
Closed on
Aug 13, 2018
Sold by
J & J Paye Family Llc
Bought by
Revo James D and Revo Judith
Purchase Details
Closed on
Jan 25, 2018
Sold by
J & J Paye Family Llc
Bought by
Revo James D and Revo Judith
Purchase Details
Closed on
Feb 27, 2008
Sold by
Paye James D and Paye Judith E
Bought by
Paye James D and Paye Judith E
Create a Home Valuation Report for This Property
The Home Valuation Report is an in-depth analysis detailing your home's value as well as a comparison with similar homes in the area
Home Values in the Area
Average Home Value in this Area
Purchase History
| Date | Buyer | Sale Price | Title Company |
|---|---|---|---|
| Payes Investment Properties Llc | -- | None Listed On Document | |
| Revo James D | -- | None Listed On Document | |
| Revo James D | -- | None Listed On Document | |
| Paye James D | -- | None Available |
Source: Public Records
Tax History
| Year | Tax Paid | Tax Assessment Tax Assessment Total Assessment is a certain percentage of the fair market value that is determined by local assessors to be the total taxable value of land and additions on the property. | Land | Improvement |
|---|---|---|---|---|
| 2025 | $800 | $77,780 | $56,575 | $21,205 |
| 2024 | $800 | $76,256 | $55,466 | $20,790 |
| 2023 | $789 | $74,762 | $54,379 | $20,383 |
| 2022 | $819 | $73,297 | $53,313 | $19,984 |
| 2021 | $767 | $71,861 | $52,268 | $19,593 |
| 2020 | $761 | $71,126 | $51,733 | $19,393 |
| 2019 | $745 | $69,732 | $50,719 | $19,013 |
| 2018 | $734 | $68,366 | $49,725 | $18,641 |
| 2017 | $731 | $67,026 | $48,750 | $18,276 |
| 2016 | $731 | $65,713 | $47,795 | $17,918 |
| 2015 | $724 | $64,727 | $47,078 | $17,649 |
| 2014 | $677 | $63,460 | $46,156 | $17,304 |
Source: Public Records
Map
Nearby Homes
Your Personal Tour Guide
Ask me questions while you tour the home.