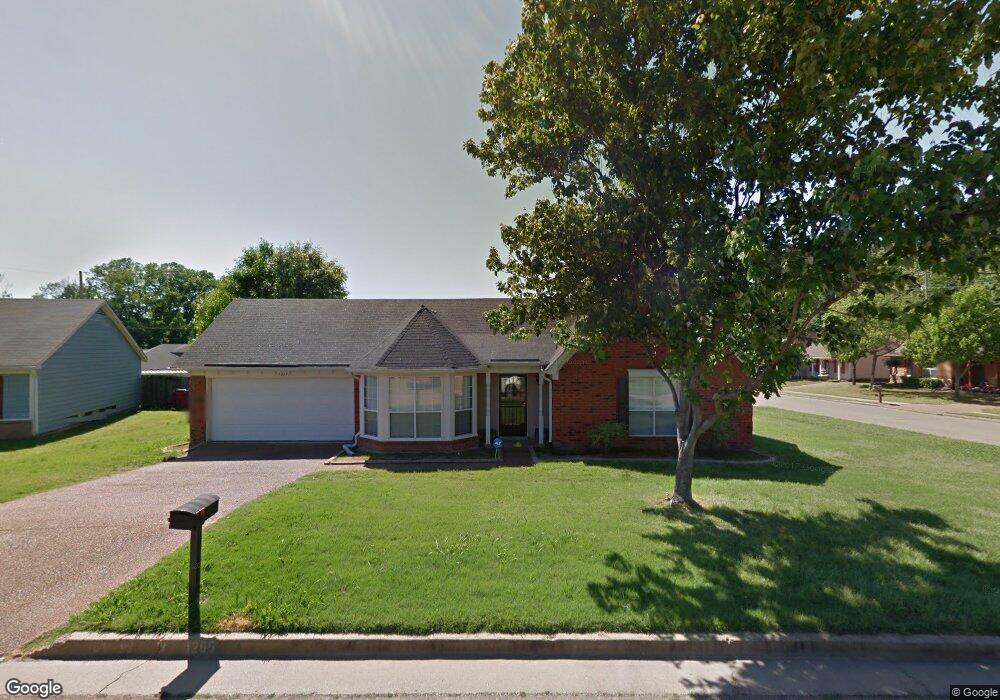
1265 Trotters Stop Cove Cordova, TN 38018
Cordova NeighborhoodEstimated Value: $221,989 - $244,000
3
Beds
2
Baths
1,419
Sq Ft
$161/Sq Ft
Est. Value
About This Home
This home is located at 1265 Trotters Stop Cove, Cordova, TN 38018 and is currently estimated at $228,747, approximately $161 per square foot. 1265 Trotters Stop Cove is a home located in Shelby County with nearby schools including Dexter Elementary School, Dexter Middle School, and Cordova High School.
Ownership History
Date
Name
Owned For
Owner Type
Purchase Details
Closed on
Nov 30, 2010
Sold by
Crosby Angela M
Bought by
Mcneal Annie L and Mcneal Leviticus
Current Estimated Value
Home Financials for this Owner
Home Financials are based on the most recent Mortgage that was taken out on this home.
Original Mortgage
$63,352
Outstanding Balance
$42,648
Interest Rate
4.75%
Mortgage Type
FHA
Estimated Equity
$186,099
Purchase Details
Closed on
Aug 5, 2005
Sold by
Hartunian Keary P and Hartunian Kristie L
Bought by
Crosby Angela M
Home Financials for this Owner
Home Financials are based on the most recent Mortgage that was taken out on this home.
Original Mortgage
$99,600
Interest Rate
6.45%
Mortgage Type
Purchase Money Mortgage
Purchase Details
Closed on
Sep 19, 2000
Sold by
Vickery James L
Bought by
Hartunian Keary P and Hartunian Kristie L
Home Financials for this Owner
Home Financials are based on the most recent Mortgage that was taken out on this home.
Original Mortgage
$108,944
Interest Rate
7.97%
Create a Home Valuation Report for This Property
The Home Valuation Report is an in-depth analysis detailing your home's value as well as a comparison with similar homes in the area
Home Values in the Area
Average Home Value in this Area
Purchase History
| Date | Buyer | Sale Price | Title Company |
|---|---|---|---|
| Mcneal Annie L | $65,000 | Regency Title & Escrow Llc | |
| Crosby Angela M | $124,500 | Archer Land Title | |
| Hartunian Keary P | $109,000 | West Tn Title Insurance Agen | |
| Hartunian Keary P | $109,000 | West Tn Title Insurance Agen |
Source: Public Records
Mortgage History
| Date | Status | Borrower | Loan Amount |
|---|---|---|---|
| Open | Mcneal Annie L | $63,352 | |
| Previous Owner | Crosby Angela M | $99,600 | |
| Previous Owner | Hartunian Keary P | $108,944 |
Source: Public Records
Tax History Compared to Growth
Tax History
| Year | Tax Paid | Tax Assessment Tax Assessment Total Assessment is a certain percentage of the fair market value that is determined by local assessors to be the total taxable value of land and additions on the property. | Land | Improvement |
|---|---|---|---|---|
| 2025 | $1,435 | $56,675 | $8,750 | $47,925 |
| 2024 | $1,435 | $42,325 | $6,875 | $35,450 |
| 2023 | $1,435 | $42,325 | $6,875 | $35,450 |
| 2022 | $1,435 | $42,325 | $6,875 | $35,450 |
| 2021 | $1,460 | $42,325 | $6,875 | $35,450 |
| 2020 | $1,135 | $28,025 | $6,875 | $21,150 |
| 2019 | $1,135 | $28,025 | $6,875 | $21,150 |
| 2018 | $1,135 | $28,025 | $6,875 | $21,150 |
| 2017 | $1,152 | $28,025 | $6,875 | $21,150 |
| 2016 | $1,179 | $26,975 | $0 | $0 |
| 2014 | $1,179 | $26,975 | $0 | $0 |
Source: Public Records
Map
Nearby Homes
- 6884 Wrigley Dr
- 6880 Wrigley Dr
- 6774 Whitten Pine Dr
- 6838 Lagrange Cir N
- 6916 Lagrange Pines Rd
- 1382 Exbury Dr
- 6890 Century Oaks Dr
- 7035 S Estacada Way
- 7194 Charlton Way
- 6452 Macon Rd
- 7247 Winterbrook Ln
- 7412 Lost Trail Dr
- 7410 Appling Rain Dr
- 7407 Lost Grove Ln
- 7426 Lost Trail Dr
- 1339 Mullins Station Rd
- 1089 Links View Ln W
- 7303 Winterbrook Ln
- 7468 Links View Ln S
- 7520 Crystal Lake Dr
- 6903 Gallop Dr
- 1259 Trotters Stop Cove
- 6925 Gallop Dr
- 6899 Gallop Dr
- 6910 Gallop Dr
- 1253 Trotters Stop Cove
- 1256 Trotters Stop Cove
- 6916 Gallop Dr
- 6904 Gallop Dr
- 6884 Brady Hill Dr
- 6898 Gallop Dr
- 6893 Gallop Dr
- 1247 Trotters Stop Cove
- 6878 Brady Hill Dr
- 6890 Brady Hill Dr
- 6931 Gallop Dr
- 1244 Trotters Stop Cove
- 6928 Gallop Dr
- 6896 Brady Hill Dr
- 6892 Gallop Dr