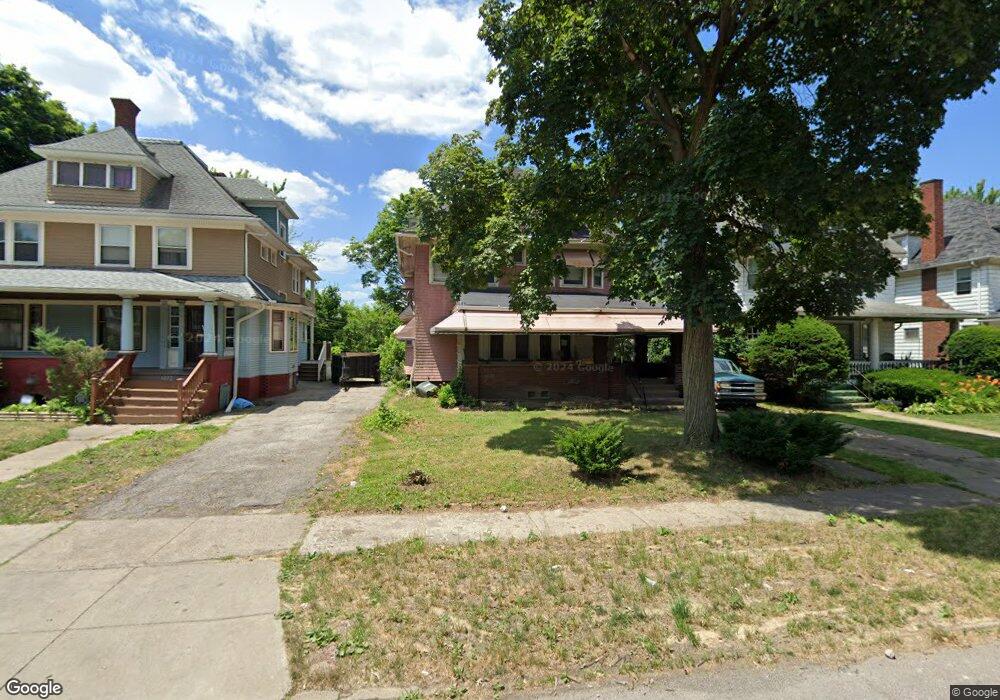
1266 Carlyon Rd Cleveland, OH 44112
Estimated Value: $49,000 - $94,000
5
Beds
2
Baths
1,970
Sq Ft
$41/Sq Ft
Est. Value
About This Home
This home is located at 1266 Carlyon Rd, Cleveland, OH 44112 and is currently estimated at $79,980, approximately $40 per square foot. 1266 Carlyon Rd is a home located in Cuyahoga County with nearby schools including Shaw High School, Citizens Academy, and Montessori High School at University Circle.
Ownership History
Date
Name
Owned For
Owner Type
Purchase Details
Closed on
Oct 5, 2018
Sold by
Moore Allan Dean and Harbour Vanita
Bought by
Crenshaw Willie
Current Estimated Value
Purchase Details
Closed on
Apr 22, 2003
Sold by
Emc Mortgage Corp
Bought by
Moore Allan D and Harbour Vanita
Purchase Details
Closed on
Oct 17, 2002
Sold by
Mcleod Allen and Mcleod Anita M
Bought by
Emc Mtg Corp
Purchase Details
Closed on
Jul 30, 1992
Bought by
Mcleod Allen
Purchase Details
Closed on
Jan 8, 1992
Sold by
Tufts Jerald L and Tufts Anna M
Bought by
Society National Bank
Purchase Details
Closed on
Oct 1, 1984
Bought by
Tufts Jerald L and Tufts Anna M
Purchase Details
Closed on
Jan 24, 1984
Sold by
Steele John L
Bought by
Socity National Bank
Purchase Details
Closed on
Dec 7, 1979
Sold by
Thrash Willie B and Thrash Alice
Bought by
Steele John L
Purchase Details
Closed on
Jan 1, 1975
Bought by
Thrash Willie B and Thrash Alice
Create a Home Valuation Report for This Property
The Home Valuation Report is an in-depth analysis detailing your home's value as well as a comparison with similar homes in the area
Home Values in the Area
Average Home Value in this Area
Purchase History
| Date | Buyer | Sale Price | Title Company |
|---|---|---|---|
| Crenshaw Willie | $6,000 | None Available | |
| Moore Allan D | $25,000 | -- | |
| Emc Mtg Corp | $40,000 | -- | |
| Mcleod Allen | $24,000 | -- | |
| Society National Bank | $24,000 | -- | |
| Tufts Jerald L | $36,500 | -- | |
| Socity National Bank | $14,000 | -- | |
| Steele John L | $33,000 | -- | |
| Thrash Willie B | -- | -- |
Source: Public Records
Tax History Compared to Growth
Tax History
| Year | Tax Paid | Tax Assessment Tax Assessment Total Assessment is a certain percentage of the fair market value that is determined by local assessors to be the total taxable value of land and additions on the property. | Land | Improvement |
|---|---|---|---|---|
| 2024 | $781 | $10,500 | $3,150 | $7,350 |
| 2023 | $1,398 | $14,280 | $1,610 | $12,670 |
| 2022 | $1,394 | $14,280 | $1,610 | $12,670 |
| 2021 | $1,384 | $14,280 | $1,610 | $12,670 |
| 2020 | $1,337 | $12,640 | $1,440 | $11,200 |
| 2019 | $1,396 | $36,100 | $4,100 | $32,000 |
| 2018 | $1,390 | $12,640 | $1,440 | $11,200 |
| 2017 | $1,461 | $14,460 | $2,840 | $11,620 |
| 2016 | $1,450 | $14,460 | $2,840 | $11,620 |
| 2015 | $1,555 | $14,460 | $2,840 | $11,620 |
| 2014 | $1,555 | $17,020 | $3,330 | $13,690 |
Source: Public Records
Map
Nearby Homes
- 1229 Melbourne Rd
- 1217 E 125th St
- 1184 Melbourne Rd
- 1200 E 125th St
- 1679 Lockwood Ave
- 1168 N Lockwood Ave
- 1333 E 124th St
- 1198 Rozelle Ave
- 12208 Ingomar Ave
- 12337 Chesterfield Ave
- 1358 E 123rd St
- 11706 Osceola Ave
- 1069 Carlyon Rd
- 1353 E 117th St
- 12006 Castlewood Ave
- 1827 Idlewood Ave
- 1423 E 120th St
- 1317 E 115th St
- 990 E 129th St
- 1003 Eddy Rd
- 1262 Carlyon Rd
- 1272 Carlyon Rd
- 1258 Carlyon Rd
- 1278 Carlyon Rd
- 1254 Carlyon Rd
- 1263 E 125th St
- 1282 Carlyon Rd
- 1257 E 125th St
- 1250 Carlyon Rd
- 1265 Carlyon Rd
- 1255 E 125th St
- 1269 Carlyon Rd
- 1273 Carlyon Rd
- 1286 Carlyon Rd
- 1259 Carlyon Rd
- 1279 Carlyon Rd
- 1251 E 125th St
- 1255 Carlyon Rd
- 1283 E 125th St
- 1283 Carlyon Rd