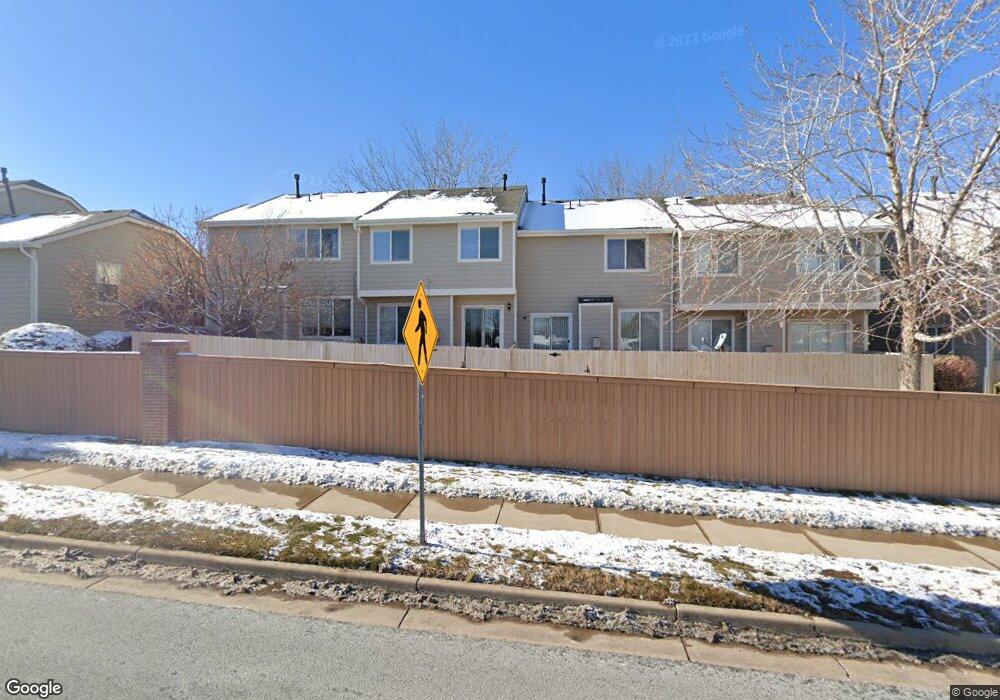
1266 S Zeno Cir Unit A Aurora, CO 80017
Aurora Highlands NeighborhoodEstimated Value: $310,872 - $339,000
3
Beds
3
Baths
1,240
Sq Ft
$260/Sq Ft
Est. Value
About This Home
This home is located at 1266 S Zeno Cir Unit A, Aurora, CO 80017 and is currently estimated at $322,968, approximately $260 per square foot. 1266 S Zeno Cir Unit A is a home located in Arapahoe County with nearby schools including Arkansas Elementary School, Mrachek Middle School, and Rangeview High School.
Ownership History
Date
Name
Owned For
Owner Type
Purchase Details
Closed on
May 24, 2004
Sold by
Miller Christopher L and Vogel Eric L
Bought by
Bittler Marchann M
Current Estimated Value
Home Financials for this Owner
Home Financials are based on the most recent Mortgage that was taken out on this home.
Original Mortgage
$107,880
Outstanding Balance
$50,580
Interest Rate
5.5%
Mortgage Type
Purchase Money Mortgage
Estimated Equity
$272,388
Purchase Details
Closed on
Feb 27, 2004
Sold by
Groshong Lisa E
Bought by
Miller Christopher L and Vogel Eric L
Home Financials for this Owner
Home Financials are based on the most recent Mortgage that was taken out on this home.
Original Mortgage
$125,280
Interest Rate
5.65%
Mortgage Type
Purchase Money Mortgage
Purchase Details
Closed on
Mar 5, 1999
Sold by
Kaufman & Broad Of Colorado Inc
Bought by
Groshong Lisa E
Home Financials for this Owner
Home Financials are based on the most recent Mortgage that was taken out on this home.
Original Mortgage
$104,075
Interest Rate
6.73%
Mortgage Type
FHA
Create a Home Valuation Report for This Property
The Home Valuation Report is an in-depth analysis detailing your home's value as well as a comparison with similar homes in the area
Home Values in the Area
Average Home Value in this Area
Purchase History
| Date | Buyer | Sale Price | Title Company |
|---|---|---|---|
| Bittler Marchann M | $134,850 | Fahtco | |
| Miller Christopher L | $139,200 | Fahtco | |
| Groshong Lisa E | $106,580 | -- |
Source: Public Records
Mortgage History
| Date | Status | Borrower | Loan Amount |
|---|---|---|---|
| Open | Bittler Marchann M | $107,880 | |
| Previous Owner | Miller Christopher L | $125,280 | |
| Previous Owner | Groshong Lisa E | $104,075 |
Source: Public Records
Tax History Compared to Growth
Tax History
| Year | Tax Paid | Tax Assessment Tax Assessment Total Assessment is a certain percentage of the fair market value that is determined by local assessors to be the total taxable value of land and additions on the property. | Land | Improvement |
|---|---|---|---|---|
| 2024 | $1,775 | $19,095 | -- | -- |
| 2023 | $1,775 | $19,095 | $0 | $0 |
| 2022 | $1,808 | $18,008 | $0 | $0 |
| 2021 | $1,867 | $18,008 | $0 | $0 |
| 2020 | $1,776 | $17,060 | $0 | $0 |
| 2019 | $1,767 | $17,060 | $0 | $0 |
| 2018 | $1,558 | $14,738 | $0 | $0 |
| 2017 | $1,356 | $14,738 | $0 | $0 |
| 2016 | $963 | $10,245 | $0 | $0 |
| 2015 | $929 | $10,245 | $0 | $0 |
| 2014 | -- | $5,683 | $0 | $0 |
| 2013 | -- | $7,290 | $0 | $0 |
Source: Public Records
Map
Nearby Homes
- 1295 S Zeno Cir Unit C
- 18234 E Arizona Ave Unit B
- 1283 S Bahama St
- 1172 S Zeno Way Unit F
- 1110 S Waco St Unit D
- 18131 E Arizona Ave Unit F
- 18131 E Arizona Ave Unit B
- 1100 S Waco St Unit G
- 1148 S Ventura Cir Unit C
- 1044 S Yampa St Unit C
- 1107 S Biscay Ct
- 1179 S Waco St Unit E
- 1199 S Waco St Unit E
- 1159 S Waco St Unit C
- 1099 S Walden Way Unit 205
- 1147 S Ventura Cir Unit D
- 1404 S Argonne Cir
- 1079 S Walden Way Unit 217
- 1117 S Ventura Cir Unit E
- 18751 E Arkansas Place
- 1266 S Zeno Cir Unit D
- 1266 S Zeno Cir Unit C
- 1266 S Zeno Cir Unit B
- 1256 S Zeno Cir Unit F
- 1256 S Zeno Cir Unit D
- 1256 S Zeno Cir Unit C
- 1256 S Zeno Cir Unit A
- 1276 S Zeno Cir Unit F
- 1276 S Zeno Cir Unit E
- 1276 S Zeno Cir Unit D
- 1276 S Zeno Cir Unit C
- 1276 S Zeno Cir Unit B
- 1276 S Zeno Cir Unit 15C
- 1265 S Zeno Cir Unit D
- 1265 S Zeno Cir Unit C
- 1265 S Zeno Cir Unit B
- 1265 S Zeno Cir Unit A
- 1246 S Zeno Cir Unit F
- 1246 S Zeno Cir Unit D
- 1246 S Zeno Cir Unit C