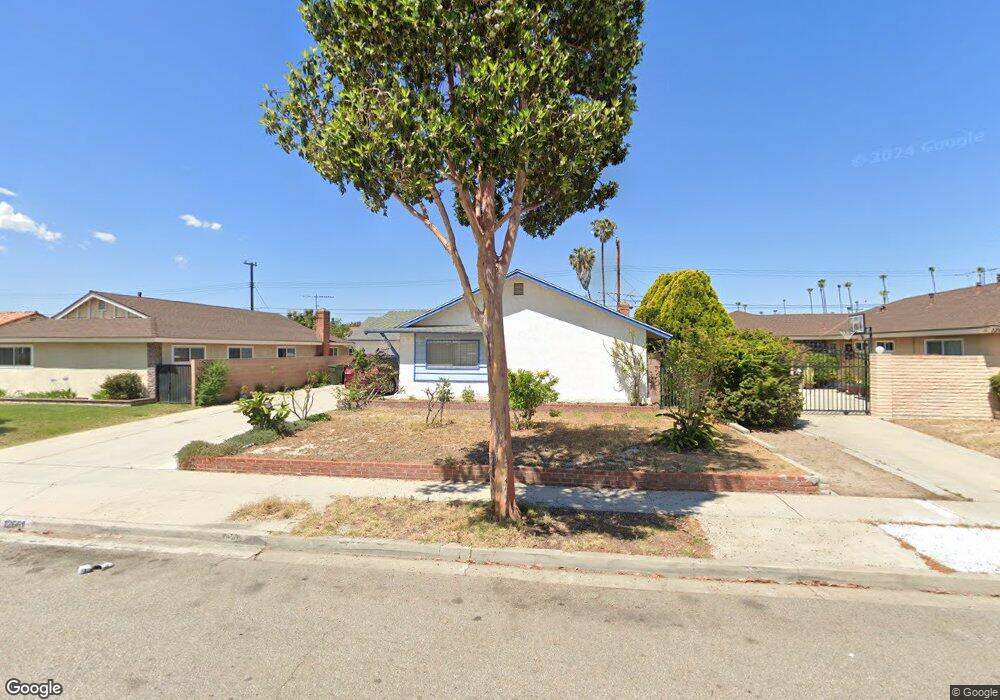
12661 Arletta Cir Garden Grove, CA 92840
Estimated Value: $948,738 - $1,068,000
4
Beds
2
Baths
1,701
Sq Ft
$602/Sq Ft
Est. Value
About This Home
This home is located at 12661 Arletta Cir, Garden Grove, CA 92840 and is currently estimated at $1,023,935, approximately $601 per square foot. 12661 Arletta Cir is a home located in Orange County with nearby schools including Lampson Elementary School, Portola Middle School, and Orange High School.
Ownership History
Date
Name
Owned For
Owner Type
Purchase Details
Closed on
Jun 1, 2018
Sold by
Nguyen Duyen Thi
Bought by
Nguyen Duyen Thi and The Duyen Thi Nguyen Family Trust
Current Estimated Value
Purchase Details
Closed on
Mar 2, 2006
Sold by
Nguyen Yen and Nguyen Duyen Thi
Bought by
Nguyen Duyen Thi
Purchase Details
Closed on
Sep 29, 2001
Sold by
Nguyen Yen and Nguyen Hoc Van
Bought by
Nguyen Yen and Nguyen Duyen Thi
Purchase Details
Closed on
Jun 23, 2001
Sold by
Vanvannguyen Hung Van
Bought by
Nguyen Yen and Nguyen Hoc Van
Purchase Details
Closed on
Aug 19, 1998
Sold by
Gardner Dianne M
Bought by
Nguyen Yen and Nguyen Hoc Van
Home Financials for this Owner
Home Financials are based on the most recent Mortgage that was taken out on this home.
Original Mortgage
$142,000
Outstanding Balance
$29,521
Interest Rate
6.88%
Estimated Equity
$994,414
Create a Home Valuation Report for This Property
The Home Valuation Report is an in-depth analysis detailing your home's value as well as a comparison with similar homes in the area
Home Values in the Area
Average Home Value in this Area
Purchase History
| Date | Buyer | Sale Price | Title Company |
|---|---|---|---|
| Nguyen Duyen Thi | -- | None Available | |
| Nguyen Duyen Thi | -- | None Available | |
| Nguyen Yen | -- | -- | |
| Nguyen Yen | -- | -- | |
| Nguyen Yen | $178,000 | Stewart Title |
Source: Public Records
Mortgage History
| Date | Status | Borrower | Loan Amount |
|---|---|---|---|
| Open | Nguyen Yen | $142,000 |
Source: Public Records
Tax History Compared to Growth
Tax History
| Year | Tax Paid | Tax Assessment Tax Assessment Total Assessment is a certain percentage of the fair market value that is determined by local assessors to be the total taxable value of land and additions on the property. | Land | Improvement |
|---|---|---|---|---|
| 2025 | $6,962 | $585,426 | $489,793 | $95,633 |
| 2024 | $6,962 | $573,948 | $480,190 | $93,758 |
| 2023 | $6,810 | $562,695 | $470,775 | $91,920 |
| 2022 | $6,679 | $551,662 | $461,544 | $90,118 |
| 2021 | $6,498 | $540,846 | $452,495 | $88,351 |
| 2020 | $6,438 | $535,301 | $447,855 | $87,446 |
| 2019 | $6,355 | $524,805 | $439,073 | $85,732 |
| 2018 | $6,258 | $514,515 | $430,464 | $84,051 |
| 2017 | $6,010 | $504,427 | $422,024 | $82,403 |
| 2016 | $5,845 | $494,537 | $413,749 | $80,788 |
| 2015 | $5,761 | $487,109 | $407,534 | $79,575 |
| 2014 | $5,124 | $430,800 | $357,986 | $72,814 |
Source: Public Records
Map
Nearby Homes
- 12560 Haster St Unit 205
- 12560 Haster St Unit 204
- 12414 Fallingleaf St
- 4002 W El Rancho Ave
- 13052 Laramore Ln
- 13141 Windsor Ln
- 2302 Lori Ln
- 12171 Adrian St
- 12812 Timber Rd Unit 22
- 12848 Timber Rd Unit 33
- 2321 Downie Place
- 12071 Laguna St
- 12691 Sweetbriar Dr
- 12621 Sweetbriar Dr
- 13181 Balboa Ave
- 13131 Siemon Ave
- 13102 Partridge St Unit 7
- 13102 Partridge St Unit 54
- 12842 Palm St Unit 108
- 12842 Palm St Unit 301
- 12641 Arletta Cir
- 12671 Arletta Cir
- 12662 Audrey Cir
- 12681 Arletta Cir
- 12631 Arletta Cir
- 12642 Audrey Cir
- 12672 Audrey Cir
- 12632 Audrey Cir
- 12682 Audrey Cir
- 12662 Arletta Cir
- 12672 Arletta Cir
- 12642 Arletta Cir
- 12691 Arletta Cir
- 12621 Arletta Cir
- 12682 Arletta Cir
- 12632 Arletta Cir
- 12692 Audrey Cir
- 12622 Audrey Cir
- 12701 Arletta Cir
- 12692 Arletta Cir