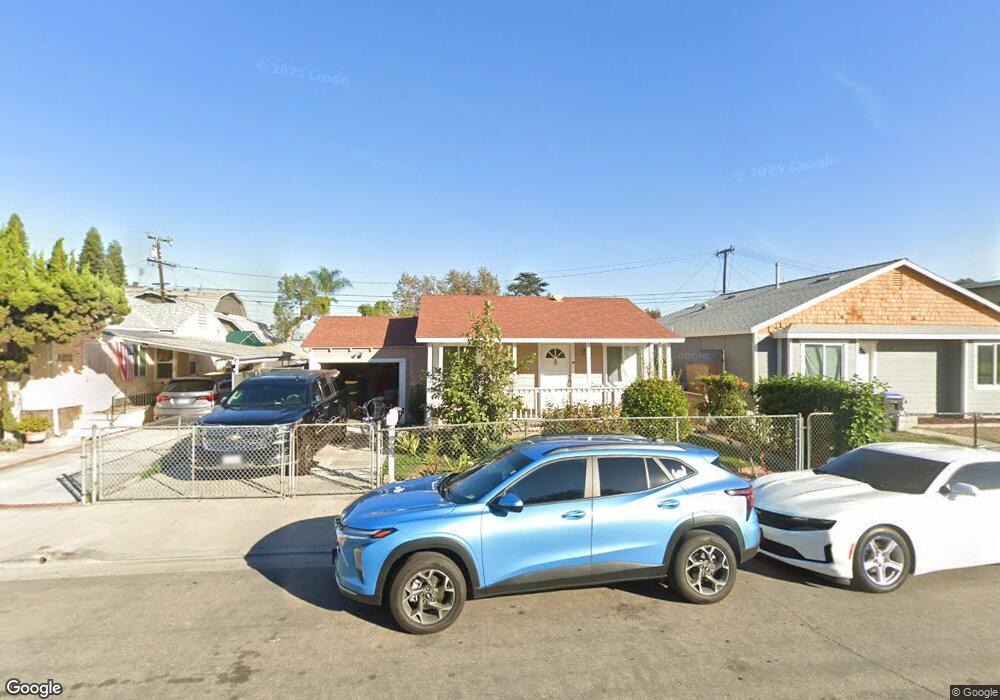
12662 Walnut Ave Garden Grove, CA 92840
Estimated Value: $817,000 - $950,000
3
Beds
2
Baths
1,456
Sq Ft
$599/Sq Ft
Est. Value
About This Home
This home is located at 12662 Walnut Ave, Garden Grove, CA 92840 and is currently estimated at $872,561, approximately $599 per square foot. 12662 Walnut Ave is a home located in Orange County with nearby schools including Stanley Elementary School, Garden Grove High School, and St. Columban School.
Ownership History
Date
Name
Owned For
Owner Type
Purchase Details
Closed on
Feb 1, 2008
Sold by
Washington Mutual Bank Fa
Bought by
Vanvannguyen Duc Van
Current Estimated Value
Home Financials for this Owner
Home Financials are based on the most recent Mortgage that was taken out on this home.
Original Mortgage
$342,000
Interest Rate
5%
Mortgage Type
Purchase Money Mortgage
Purchase Details
Closed on
Oct 26, 2007
Sold by
Karaba Tammy
Bought by
Washington Mutual Bank Fa
Purchase Details
Closed on
Mar 19, 2003
Sold by
Despalmes Dean Alois and Despalmes Laura Patrick
Bought by
Karaba Tammy
Home Financials for this Owner
Home Financials are based on the most recent Mortgage that was taken out on this home.
Original Mortgage
$259,950
Interest Rate
4.87%
Mortgage Type
Purchase Money Mortgage
Create a Home Valuation Report for This Property
The Home Valuation Report is an in-depth analysis detailing your home's value as well as a comparison with similar homes in the area
Purchase History
| Date | Buyer | Sale Price | Title Company |
|---|---|---|---|
| Vanvannguyen Duc Van | $380,000 | Lsi Title Agency | |
| Vanvannguyen Duc Van | -- | Lsi Title Agency | |
| Washington Mutual Bank Fa | $300,000 | United Title Company | |
| Karaba Tammy | $325,000 | Orange Coast Title |
Source: Public Records
Mortgage History
| Date | Status | Borrower | Loan Amount |
|---|---|---|---|
| Previous Owner | Vanvannguyen Duc Van | $342,000 | |
| Previous Owner | Karaba Tammy | $259,950 | |
| Closed | Karaba Tammy | $65,000 |
Source: Public Records
Tax History
| Year | Tax Paid | Tax Assessment Tax Assessment Total Assessment is a certain percentage of the fair market value that is determined by local assessors to be the total taxable value of land and additions on the property. | Land | Improvement |
|---|---|---|---|---|
| 2025 | $6,648 | $499,127 | $401,698 | $97,429 |
| 2024 | $6,648 | $489,341 | $393,822 | $95,519 |
| 2023 | $6,518 | $479,747 | $386,100 | $93,647 |
| 2022 | $6,398 | $470,341 | $378,530 | $91,811 |
| 2021 | $6,308 | $461,119 | $371,108 | $90,011 |
| 2020 | $6,033 | $456,391 | $367,302 | $89,089 |
| 2019 | $6,106 | $447,443 | $360,100 | $87,343 |
| 2018 | $5,791 | $438,670 | $353,039 | $85,631 |
| 2017 | $5,892 | $430,069 | $346,117 | $83,952 |
| 2016 | $5,452 | $421,637 | $339,331 | $82,306 |
| 2015 | $5,424 | $415,304 | $334,234 | $81,070 |
| 2014 | $4,974 | $396,000 | $321,820 | $74,180 |
Source: Public Records
Map
Nearby Homes
- 12600 Euclid St Unit 20
- 12635 Main St Unit 201
- 12555 Euclid St Unit 34
- 11390 Lampson Ave Unit 8
- 12332 Euclid St
- 11441 Stanford Ave
- 10701 Lauren Cir
- 12256 Lesley St
- 12301 Ellen St
- 11102 Avolencia Place
- 10941 Allen Dr
- 10641 Lakeside Dr S Unit 249
- 10551 Lakeside Dr S
- 10531 Lakeside Dr S Unit J
- 10520 Lakeside Dr N Unit L
- 11662 Pickett Ln
- 11716 Rose Dr
- 10401 Hammontree Dr
- 11741 Rose Dr
- 10422 Bonnie Dr
- 12652 Walnut Ave
- 12672 Walnut Ave
- 12642 Walnut Ave
- 12661 Pine St
- 12671 Pine St
- 12641 Pine St
- 12681 Pine St
- 12632 Walnut Ave
- 12694 Walnut Ave
- 12691 Pine St
- 12622 Walnut Ave
- 12621 Pine St
- 12640 Euclid St
- 12640 Euclid St Unit 111
- 12640 Euclid St Unit 208
- 12640 Euclid St Unit 109
- 12640 Euclid St Unit 102
- 12640 Euclid St Unit 110
- 12640 Euclid St Unit 205
- 12640 Euclid St Unit 209
Your Personal Tour Guide
Ask me questions while you tour the home.