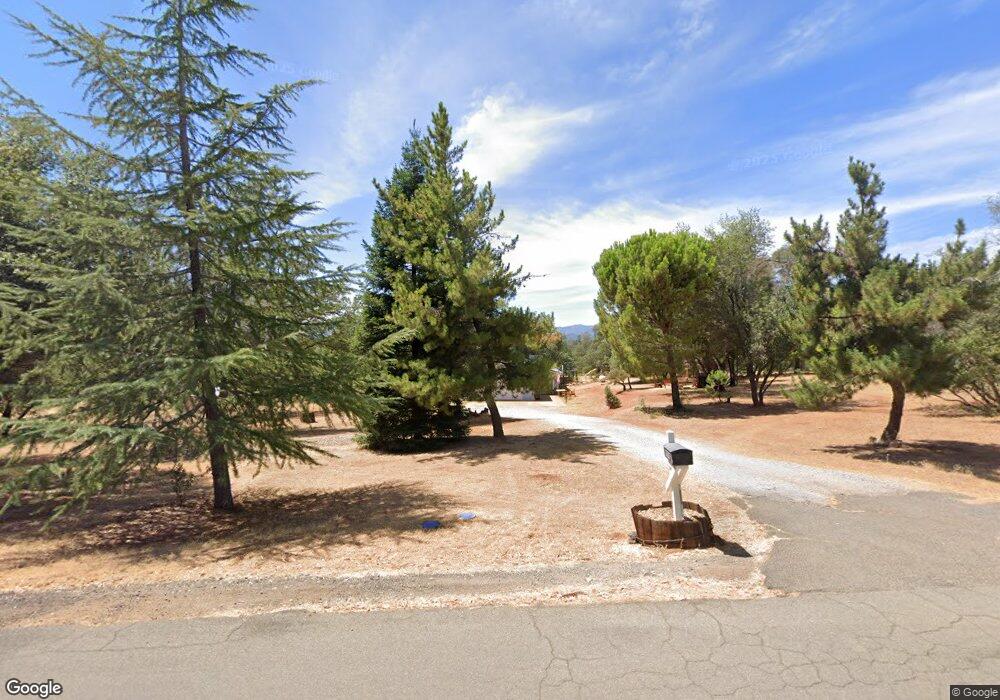
12668 Encanto Way Redding, CA 96003
Estimated Value: $358,662 - $501,000
3
Beds
2
Baths
1,410
Sq Ft
$288/Sq Ft
Est. Value
About This Home
This home is located at 12668 Encanto Way, Redding, CA 96003 and is currently estimated at $406,416, approximately $288 per square foot. 12668 Encanto Way is a home located in Shasta County.
Ownership History
Date
Name
Owned For
Owner Type
Purchase Details
Closed on
Jul 16, 2018
Sold by
Bray Scott R and Bray Charity A
Bought by
Bray Charity A and Laws Regina Renee
Current Estimated Value
Purchase Details
Closed on
Mar 20, 2015
Sold by
Bray Charity A and Laws Regina Renee
Bought by
Bray Scott R and Bray Charity A
Home Financials for this Owner
Home Financials are based on the most recent Mortgage that was taken out on this home.
Original Mortgage
$121,481
Interest Rate
3.67%
Mortgage Type
FHA
Purchase Details
Closed on
Oct 13, 2006
Sold by
Molitoris Kathleen M
Bought by
Molitoris Kathleen M
Home Financials for this Owner
Home Financials are based on the most recent Mortgage that was taken out on this home.
Original Mortgage
$130,000
Interest Rate
6.44%
Mortgage Type
Stand Alone Refi Refinance Of Original Loan
Purchase Details
Closed on
May 9, 2006
Sold by
Molitoris John A
Bought by
Molitoris Kathleen M
Create a Home Valuation Report for This Property
The Home Valuation Report is an in-depth analysis detailing your home's value as well as a comparison with similar homes in the area
Home Values in the Area
Average Home Value in this Area
Purchase History
| Date | Buyer | Sale Price | Title Company |
|---|---|---|---|
| Bray Charity A | -- | None Available | |
| Bray Scott R | $61,000 | First American Title | |
| Molitoris Kathleen M | -- | Alliance Title Company | |
| Molitoris Kathleen M | -- | Chicago Title Co |
Source: Public Records
Mortgage History
| Date | Status | Borrower | Loan Amount |
|---|---|---|---|
| Closed | Bray Scott R | $121,481 | |
| Closed | Molitoris Kathleen M | $130,000 |
Source: Public Records
Tax History Compared to Growth
Tax History
| Year | Tax Paid | Tax Assessment Tax Assessment Total Assessment is a certain percentage of the fair market value that is determined by local assessors to be the total taxable value of land and additions on the property. | Land | Improvement |
|---|---|---|---|---|
| 2025 | $2,616 | $230,245 | $61,888 | $168,357 |
| 2024 | $2,565 | $225,731 | $60,675 | $165,056 |
| 2023 | $2,565 | $221,306 | $59,486 | $161,820 |
| 2022 | $2,485 | $216,968 | $58,320 | $158,648 |
| 2021 | $2,477 | $212,715 | $57,177 | $155,538 |
| 2020 | $2,448 | $210,535 | $56,591 | $153,944 |
| 2019 | $2,373 | $206,408 | $55,482 | $150,926 |
| 2018 | $2,222 | $183,882 | $63,622 | $120,260 |
| 2017 | $2,185 | $180,277 | $62,375 | $117,902 |
| 2016 | $2,094 | $176,743 | $61,152 | $115,591 |
| 2015 | $1,576 | $133,487 | $47,304 | $86,183 |
| 2014 | -- | $130,873 | $46,378 | $84,495 |
Source: Public Records
Map
Nearby Homes
- 12832 Los Osos St
- 19988 Paso Robles Ave
- 19679 Midland Dr
- 12723 Old Oregon Trail
- 0 Spring Lake St
- 13160 Bear Mountain Rd
- 12910 Old Oregon Trail
- 0 Bear Mountain Rd Unit 25-3999
- 13155 Tierra Heights Rd
- 13315 Tierra Heights Rd
- 13323 Alicia Pkwy
- 19626 San Vincente Dr
- 13320 Tierra Heights Rd
- 19623 San Vincente Dr
- 13231 Alicia Pkwy
- 13365 Tierra Heights Rd
- 13335 Alicia Pkwy
- 19566 San Vincente Dr
- 20509 Bernard Way
- 19565 San Vincente Dr
- 12684 Encanto Way
- 12640 Encanto Way
- 12667 Encanto Way
- 12692 Encanto Way
- 12641 Los Osos St
- 12606 Encanto Way
- 12701 Encanto Way
- 12623 Encanto Way
- 12710 Encanto Way
- 12605 Encanto Way
- 12719 Encanto Way
- 12631 Encanto Way
- 12728 Encanto Way
- 12599 Los Osos St
- 12745 Encanto Way
- 12625 Encanto Way
- 20188 Lago St
- 12570 Encanto Way
- 12754 Encanto Way
- 12616 Los Osos St