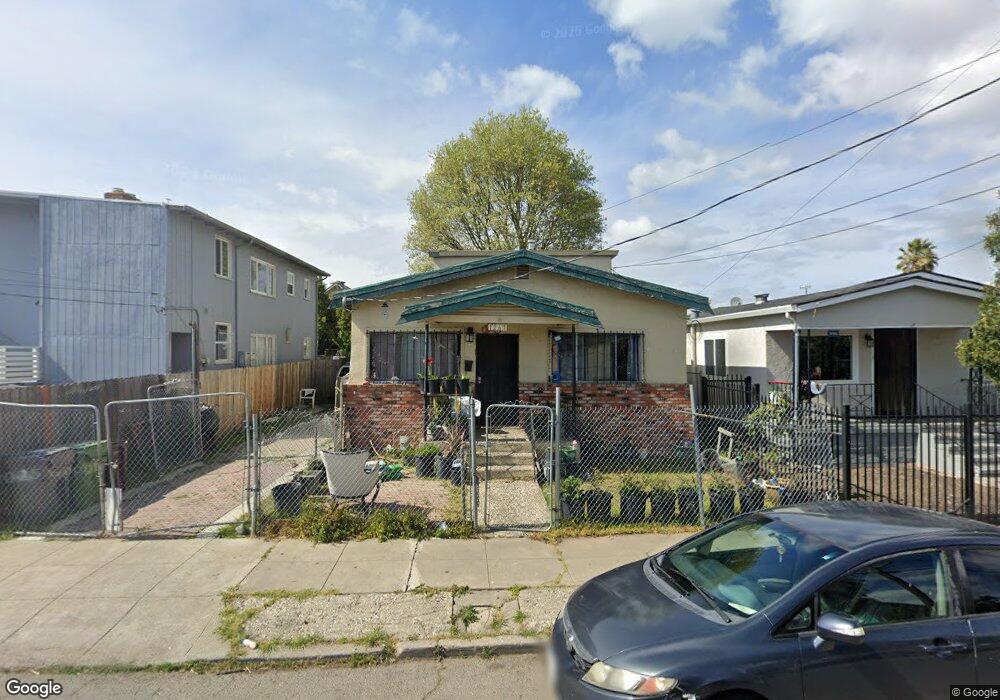
1267 77th Ave Oakland, CA 94621
Fitchburg NeighborhoodEstimated Value: $426,635 - $544,000
3
Beds
1
Bath
1,048
Sq Ft
$455/Sq Ft
Est. Value
About This Home
This home is located at 1267 77th Ave, Oakland, CA 94621 and is currently estimated at $476,909, approximately $455 per square foot. 1267 77th Ave is a home located in Alameda County with nearby schools including Greenleaf Elementary School, Coliseum College Prep Academy, and Madison Park Academy (6-12).
Ownership History
Date
Name
Owned For
Owner Type
Purchase Details
Closed on
Sep 2, 2020
Sold by
Carranza Fernando
Bought by
Family Trust and Carranza
Current Estimated Value
Purchase Details
Closed on
Mar 19, 1996
Sold by
Pacheco Alice M
Bought by
Carranza Fernando and Carranza Evelia
Purchase Details
Closed on
Oct 14, 1994
Sold by
American S&L Assn
Bought by
Pacheco Joe and Pacheco Alice M
Create a Home Valuation Report for This Property
The Home Valuation Report is an in-depth analysis detailing your home's value as well as a comparison with similar homes in the area
Home Values in the Area
Average Home Value in this Area
Purchase History
| Date | Buyer | Sale Price | Title Company |
|---|---|---|---|
| Family Trust | -- | None Listed On Document | |
| Carranza Fernando | $20,000 | Northwestern Title Company | |
| Pacheco Joe | $12,000 | -- |
Source: Public Records
Tax History
| Year | Tax Paid | Tax Assessment Tax Assessment Total Assessment is a certain percentage of the fair market value that is determined by local assessors to be the total taxable value of land and additions on the property. | Land | Improvement |
|---|---|---|---|---|
| 2025 | $2,670 | $66,445 | $19,933 | $46,512 |
| 2024 | $2,670 | $65,143 | $19,543 | $45,600 |
| 2023 | $2,674 | $63,865 | $19,159 | $44,706 |
| 2022 | $2,530 | $62,614 | $18,784 | $43,830 |
| 2021 | $2,260 | $61,386 | $18,416 | $42,970 |
| 2020 | $2,232 | $60,757 | $18,227 | $42,530 |
| 2019 | $2,049 | $59,565 | $17,869 | $41,696 |
| 2018 | $2,010 | $58,398 | $17,519 | $40,879 |
| 2017 | $1,897 | $57,253 | $17,176 | $40,077 |
| 2016 | $1,738 | $56,131 | $16,839 | $39,292 |
| 2015 | $1,725 | $55,288 | $16,586 | $38,702 |
| 2014 | $1,625 | $54,205 | $16,261 | $37,944 |
Source: Public Records
Map
Nearby Homes
Your Personal Tour Guide
Ask me questions while you tour the home.