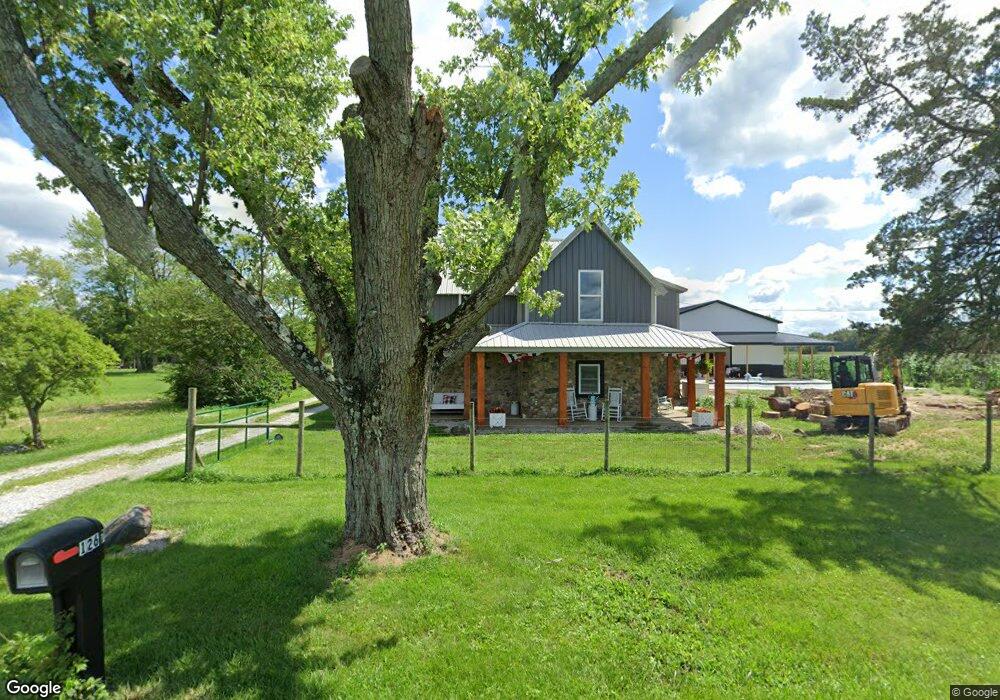
1267 W 1100 N Fountaintown, IN 46130
Estimated Value: $183,000 - $266,000
3
Beds
1
Bath
1,486
Sq Ft
$158/Sq Ft
Est. Value
About This Home
This home is located at 1267 W 1100 N, Fountaintown, IN 46130 and is currently estimated at $234,420, approximately $157 per square foot. 1267 W 1100 N is a home located in Shelby County with nearby schools including Morristown Elementary School and Morristown Junior/Senior High School.
Ownership History
Date
Name
Owned For
Owner Type
Purchase Details
Closed on
Mar 30, 2018
Sold by
Toon Bobby G
Bought by
Spiker Chad J
Current Estimated Value
Home Financials for this Owner
Home Financials are based on the most recent Mortgage that was taken out on this home.
Original Mortgage
$73,641
Interest Rate
4.5%
Mortgage Type
FHA
Purchase Details
Closed on
Oct 2, 2008
Sold by
Toon Katherine M
Bought by
Toon Bobby G
Create a Home Valuation Report for This Property
The Home Valuation Report is an in-depth analysis detailing your home's value as well as a comparison with similar homes in the area
Home Values in the Area
Average Home Value in this Area
Purchase History
| Date | Buyer | Sale Price | Title Company |
|---|---|---|---|
| Spiker Chad J | $75,000 | -- | |
| Spiker Chad J | $75,000 | Ata National Title Group Of | |
| Toon Bobby G | -- | -- |
Source: Public Records
Mortgage History
| Date | Status | Borrower | Loan Amount |
|---|---|---|---|
| Previous Owner | Spiker Chad J | $73,641 |
Source: Public Records
Tax History Compared to Growth
Tax History
| Year | Tax Paid | Tax Assessment Tax Assessment Total Assessment is a certain percentage of the fair market value that is determined by local assessors to be the total taxable value of land and additions on the property. | Land | Improvement |
|---|---|---|---|---|
| 2024 | $1,323 | $180,100 | $26,800 | $153,300 |
| 2023 | $2,260 | $217,500 | $26,800 | $190,700 |
| 2022 | $2,306 | $215,400 | $26,800 | $188,600 |
| 2021 | $2,006 | $193,100 | $26,800 | $166,300 |
| 2020 | $747 | $100,000 | $26,800 | $73,200 |
| 2019 | $594 | $85,500 | $26,200 | $59,300 |
| 2018 | $958 | $65,100 | $26,200 | $38,900 |
| 2017 | $896 | $63,900 | $26,200 | $37,700 |
| 2016 | $853 | $65,400 | $26,200 | $39,200 |
| 2014 | $777 | $61,400 | $25,100 | $36,300 |
| 2013 | $777 | $59,400 | $24,500 | $34,900 |
Source: Public Records
Map
Nearby Homes
- 5 U S 52
- 6 U S 52
- 10686 N Division Rd
- 11497 N State Road 9
- 83 E Walnut St
- 11131 N State Road 9
- 1069 W Railroad St
- 5477 S Main St
- 5465 S Greenfield St
- 256 E 1000 N
- 11546 N Shelby 300 W
- 661 W 500 S
- 11600 N 100 E
- 5555 S 200 E
- 4500 S 50 W
- 1546 E Osprey Dr
- 1898 E 1000 N
- 0 S 300 East- 2
- 1556 E 400 S
- 1744 E 850 N