
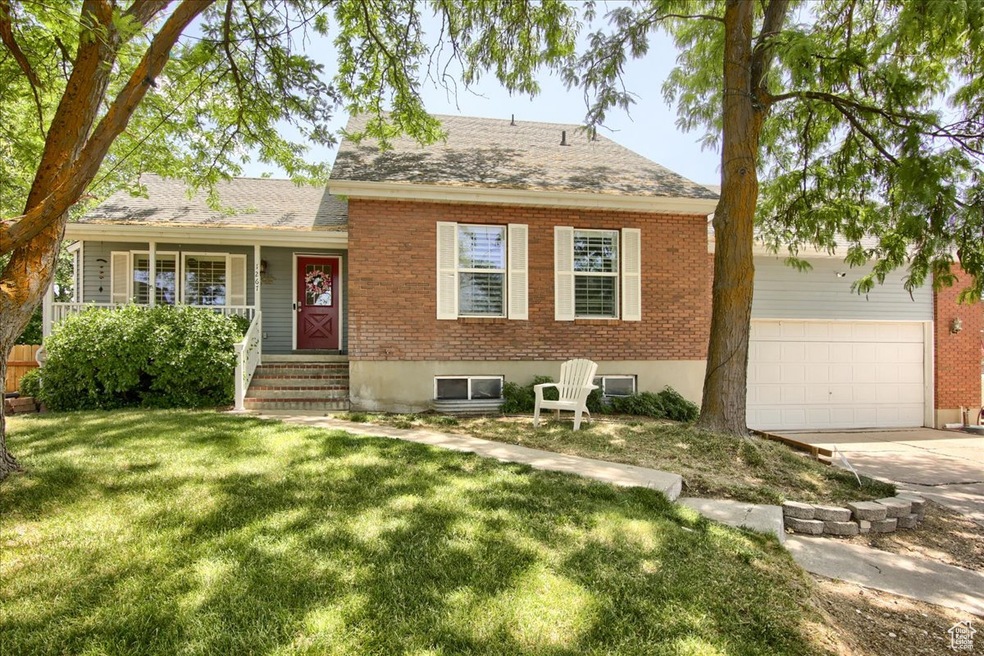


1267 W 1750 N Clearfield, UT 84015
Estimated payment $3,251/month
Total Views
3,881
6
Beds
3.5
Baths
3,088
Sq Ft
$175
Price per Sq Ft
Highlights
- Second Kitchen
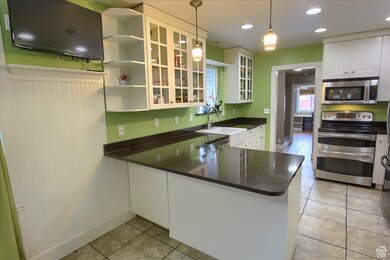
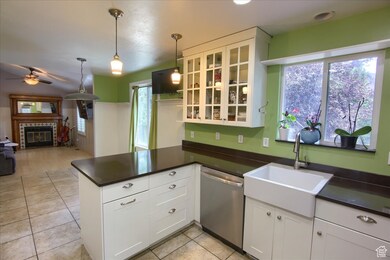
- Updated Kitchen
- Mountain View
- Solar Power System
- Fruit Trees
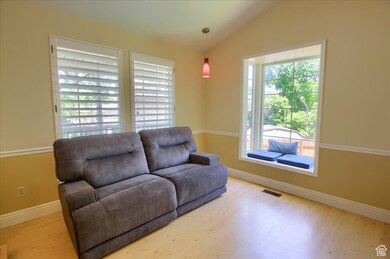
- Vaulted Ceiling
About This Home
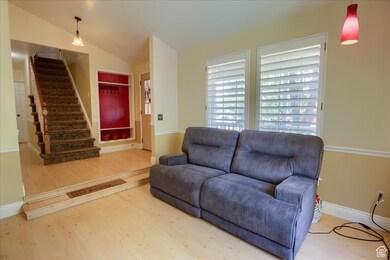
Tucked away in a quiet cul-de-sac, this 3,000+ sq ft home offers a rare blend of space, serenity, and charm. The backyard is a true retreat - mature trees, lush landscaping, and an oversized covered deck set the stage for relaxing evenings and effortless entertaining. Inside, you'll find a main-level primary suite, two bedrooms upstairs, and a 1,134 sq ft ADU in the basement with its own entrance, kitchen, 3 bedrooms, and a full bath making it perfect for guests, extended family, or rental income. With six bedrooms, three bathrooms, and leased solar panels that will be paid off at closing (energy bills around $20/month), this home is ready to welcome its next chapter - yours. Call or text to schedule your private showing today. Square footage figures are provided as a courtesy estimate only and were obtained from county records. Buyer is advised to obtain an independent measurement.
Home Details
Home Type
- Single Family
Est. Annual Taxes
- $2,913
Year Built
- Built in 1984
Lot Details
- 0.28 Acre Lot
- Cul-De-Sac
- Partially Fenced Property
- Landscaped
- Fruit Trees
- Mature Trees
- Property is zoned Single-Family
Parking
- 2 Car Attached Garage
- 8 Open Parking Spaces
Home Design
- Brick Exterior Construction
Interior Spaces
- 3,088 Sq Ft Home
- 3-Story Property
- Vaulted Ceiling
- 1 Fireplace
- Double Pane Windows
- Blinds
- Entrance Foyer
- Den
- Mountain Views
- Electric Dryer Hookup
Kitchen
- Updated Kitchen
- Second Kitchen
- Double Oven
- Free-Standing Range
- Disposal
Flooring
- Wood
- Carpet
- Laminate
- Tile
Bedrooms and Bathrooms
- 6 Bedrooms | 1 Primary Bedroom on Main
- Walk-In Closet
Basement
- Walk-Out Basement
- Basement Fills Entire Space Under The House
- Exterior Basement Entry
- Apartment Living Space in Basement
Eco-Friendly Details
- Solar Power System
- Solar owned by a third party
- Reclaimed Water Irrigation System
Outdoor Features
- Covered patio or porch
- Storage Shed
- Outbuilding
- Play Equipment
Additional Homes
- Accessory Dwelling Unit (ADU)
Schools
- Clinton Elementary School
- Sunset Middle School
- Clearfield High School
Utilities
- Forced Air Heating and Cooling System
- Natural Gas Connected
Community Details
- No Home Owners Association
Listing and Financial Details
- Home warranty included in the sale of the property
- Assessor Parcel Number 14-014-0020
Map
Create a Home Valuation Report for This Property
The Home Valuation Report is an in-depth analysis detailing your home's value as well as a comparison with similar homes in the area
Home Values in the Area
Average Home Value in this Area
Tax History
| Year | Tax Paid | Tax Assessment Tax Assessment Total Assessment is a certain percentage of the fair market value that is determined by local assessors to be the total taxable value of land and additions on the property. | Land | Improvement |
|---|---|---|---|---|
| 2024 | $2,913 | $281,600 | $115,023 | $166,577 |
| 2023 | $2,757 | $493,000 | $132,925 | $360,075 |
| 2022 | $2,974 | $294,250 | $78,814 | $215,436 |
| 2021 | $2,896 | $425,000 | $102,910 | $322,090 |
| 2020 | $2,492 | $362,000 | $89,769 | $272,231 |
| 2019 | $2,396 | $340,000 | $100,625 | $239,375 |
| 2018 | $2,267 | $316,000 | $84,447 | $231,553 |
| 2016 | $1,959 | $141,020 | $33,358 | $107,662 |
| 2015 | $1,991 | $136,290 | $33,358 | $102,932 |
| 2014 | $1,700 | $118,192 | $33,358 | $84,834 |
| 2013 | -- | $109,347 | $25,873 | $83,474 |
Source: Public Records
Property History
| Date | Event | Price | Change | Sq Ft Price |
|---|---|---|---|---|
| 06/23/2025 06/23/25 | Price Changed | $540,000 | -2.7% | $175 / Sq Ft |
| 06/01/2025 06/01/25 | For Sale | $555,000 | -- | $180 / Sq Ft |
Source: UtahRealEstate.com
Purchase History
| Date | Type | Sale Price | Title Company |
|---|---|---|---|
| Deed | -- | Stewart Title | |
| Warranty Deed | -- | None Available | |
| Special Warranty Deed | -- | None Available |
Source: Public Records
Mortgage History
| Date | Status | Loan Amount | Loan Type |
|---|---|---|---|
| Open | $336,949 | New Conventional | |
| Closed | $276,724 | FHA | |
| Closed | $284,747 | FHA | |
| Previous Owner | $192,000 | New Conventional | |
| Previous Owner | $12,000 | Unknown |
Source: Public Records
Similar Homes in Clearfield, UT
Source: UtahRealEstate.com
MLS Number: 2088860
APN: 14-014-0020
Disclaimer: Certain information contained herein is derived from information provided by parties other than Homes.com. All information provided is deemed reliable, but is not guaranteed to be accurate and should be independently verified.
![]() IDX information is provided exclusively for consumers’ personal, non-commercial use, that it may not be used for any purpose other than to identify prospective properties consumers may be interested in purchasing, and that the data is deemed reliable but is not guaranteed accurate by the MLS. Licensor is only providing the MLS Content and not other sources of data provided in the Product.
IDX information is provided exclusively for consumers’ personal, non-commercial use, that it may not be used for any purpose other than to identify prospective properties consumers may be interested in purchasing, and that the data is deemed reliable but is not guaranteed accurate by the MLS. Licensor is only providing the MLS Content and not other sources of data provided in the Product.
Based on information from the Wasatch Front Regional Multiple Listing Service, Inc.. All data, including all measurements and calculations of area, is obtained from various sources and has not been, and will not be, verified by broker or the MLS. All information should be independently reviewed and verified for accuracy. Properties may or may not be listed by the office/agent presenting the information.
Nearby Homes