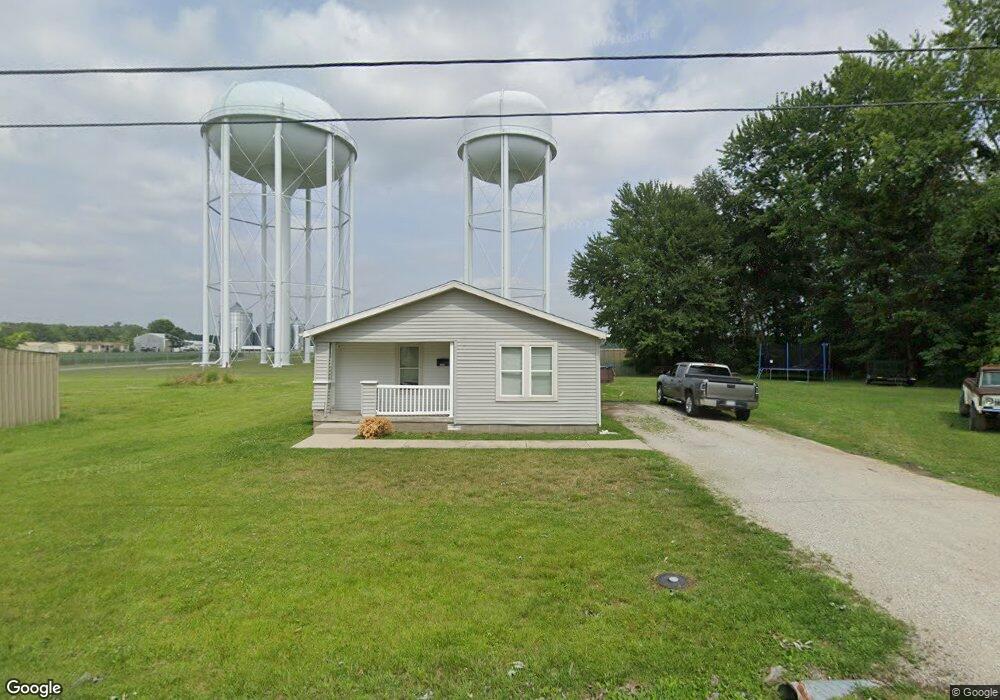
1267 Wade St Austin, IN 47102
Estimated Value: $109,000 - $176,000
3
Beds
2
Baths
1,286
Sq Ft
$113/Sq Ft
Est. Value
About This Home
This home is located at 1267 Wade St, Austin, IN 47102 and is currently estimated at $145,599, approximately $113 per square foot. 1267 Wade St is a home located in Scott County with nearby schools including Austin Elementary School, Austin Middle School, and Austin High School.
Ownership History
Date
Name
Owned For
Owner Type
Purchase Details
Closed on
Oct 31, 2017
Sold by
White Brandon and White Tyler
Bought by
Tbw Holdings Llc
Current Estimated Value
Purchase Details
Closed on
Sep 17, 2009
Sold by
Secretary Of Hud
Bought by
White Brandon and White Tyler
Home Financials for this Owner
Home Financials are based on the most recent Mortgage that was taken out on this home.
Original Mortgage
$14,800
Interest Rate
5.38%
Mortgage Type
New Conventional
Purchase Details
Closed on
Apr 9, 2009
Sold by
Countrywide Home Loans Inc
Bought by
The Sec Of Housing & U
Purchase Details
Closed on
Apr 27, 2007
Sold by
John Lizenby Sheriff
Bought by
Countrywide Home Loans Inc
Purchase Details
Closed on
Apr 3, 2007
Sold by
Sheriff Of Scott County
Bought by
Countrywide Home Loans Inc
Create a Home Valuation Report for This Property
The Home Valuation Report is an in-depth analysis detailing your home's value as well as a comparison with similar homes in the area
Home Values in the Area
Average Home Value in this Area
Purchase History
| Date | Buyer | Sale Price | Title Company |
|---|---|---|---|
| Tbw Holdings Llc | -- | None Available | |
| White Brandon | -- | Eagle Land Title Llc | |
| The Sec Of Housing & U | $89,363 | Unterberg & Associates Pc | |
| The Secretary Of Hud | -- | None Available | |
| Countrywide Home Loans Inc | $89,363 | -- | |
| Countrywide Home Loans Inc | $89,363 | Unterberg & Associates Pc |
Source: Public Records
Mortgage History
| Date | Status | Borrower | Loan Amount |
|---|---|---|---|
| Previous Owner | White Brandon | $14,800 |
Source: Public Records
Tax History
| Year | Tax Paid | Tax Assessment Tax Assessment Total Assessment is a certain percentage of the fair market value that is determined by local assessors to be the total taxable value of land and additions on the property. | Land | Improvement |
|---|---|---|---|---|
| 2024 | $754 | $83,300 | $13,500 | $69,800 |
| 2023 | $488 | $59,700 | $13,500 | $46,200 |
| 2022 | $478 | $59,600 | $13,500 | $46,100 |
| 2021 | $1,166 | $56,300 | $13,500 | $42,800 |
| 2020 | $1,146 | $57,300 | $13,500 | $43,800 |
| 2019 | $1,000 | $50,000 | $13,500 | $36,500 |
| 2018 | $1,054 | $52,700 | $13,500 | $39,200 |
| 2017 | $1,184 | $59,200 | $13,500 | $45,700 |
| 2016 | $1,148 | $57,400 | $13,500 | $43,900 |
| 2014 | $1,208 | $60,400 | $16,100 | $44,300 |
| 2013 | $1,208 | $64,100 | $16,100 | $48,000 |
Source: Public Records
Map
Nearby Homes
- 1153 Clay St
- 1154 Clay St
- 1221 N 3rd St
- 1020 N Church St
- 982 N 3rd St
- 137 Bowles Cir
- 733 Mann Ave
- 96 Hill St
- 920 N 3rd St
- 265 Rice St
- Glacier Plan at Meadowbrook
- Yellowstone Plan at Meadowbrook
- Everglades Plan at Meadowbrook
- 815 Linden Dr
- 294 Audrey Ln
- 284 Audrey Ln
- 274 Audrey Ln
- 41 Rural St
- 37 Rural St
- 138 Blunt Ave
Your Personal Tour Guide
Ask me questions while you tour the home.