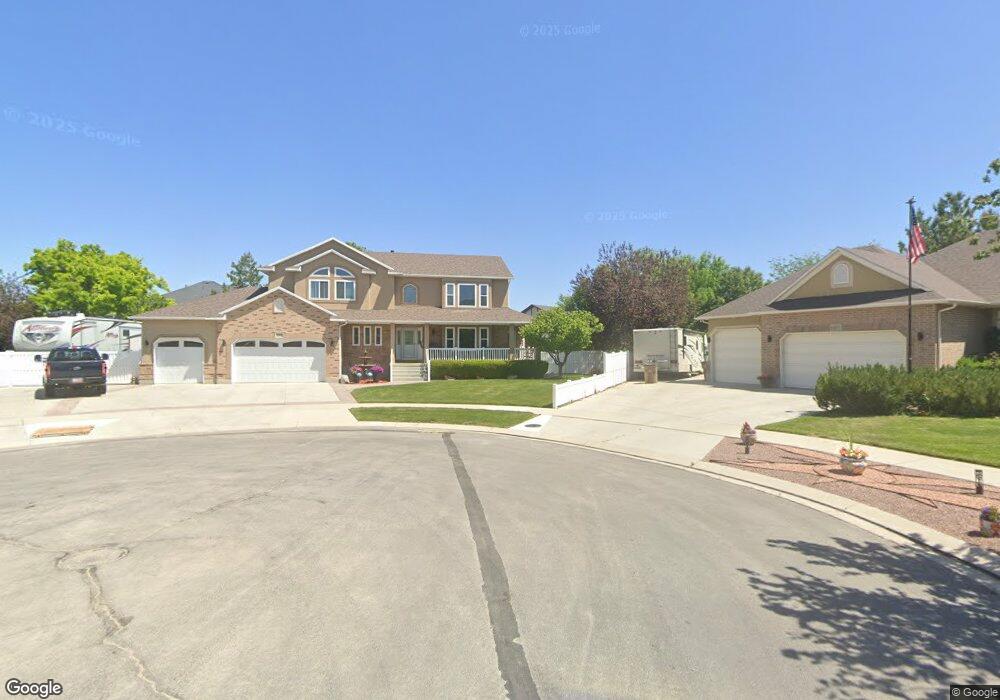
12671 Whisper Spring Cove Draper, UT 84020
Estimated Value: $908,000 - $1,021,000
6
Beds
4
Baths
2,434
Sq Ft
$396/Sq Ft
Est. Value
About This Home
This home is located at 12671 Whisper Spring Cove, Draper, UT 84020 and is currently estimated at $963,933, approximately $396 per square foot. 12671 Whisper Spring Cove is a home located in Salt Lake County with nearby schools including Draper Elementary School, Corner Canyon High School, and Draper Park Middle School.
Ownership History
Date
Name
Owned For
Owner Type
Purchase Details
Closed on
Sep 15, 2020
Sold by
Sawatzke Daniel K and Sawatzke Stephanie M
Bought by
Sawatzke Stephanie and Sawatzke Daniel Kurt
Current Estimated Value
Purchase Details
Closed on
May 22, 2013
Sold by
Sawatzke Dan and Sawatzke Stephanie
Bought by
Sawatzke Daniel K and Sawatzke Stephanie M
Home Financials for this Owner
Home Financials are based on the most recent Mortgage that was taken out on this home.
Original Mortgage
$180,000
Interest Rate
2.62%
Mortgage Type
New Conventional
Purchase Details
Closed on
Dec 21, 2001
Sold by
Olsen & Associates Construction Inc
Bought by
Sawatzke Dan and Sawatzke Stephanie
Home Financials for this Owner
Home Financials are based on the most recent Mortgage that was taken out on this home.
Original Mortgage
$180,000
Interest Rate
6.51%
Create a Home Valuation Report for This Property
The Home Valuation Report is an in-depth analysis detailing your home's value as well as a comparison with similar homes in the area
Home Values in the Area
Average Home Value in this Area
Purchase History
| Date | Buyer | Sale Price | Title Company |
|---|---|---|---|
| Sawatzke Stephanie | -- | None Available | |
| Sawatzke Daniel K | -- | Mountain View Title & Escrow | |
| Sawatzke Dan | -- | Title One | |
| Olsen & Associates Construction Inc | -- | Title One |
Source: Public Records
Mortgage History
| Date | Status | Borrower | Loan Amount |
|---|---|---|---|
| Previous Owner | Sawatzke Daniel K | $180,000 | |
| Previous Owner | Sawatzke Dan | $180,000 |
Source: Public Records
Tax History
| Year | Tax Paid | Tax Assessment Tax Assessment Total Assessment is a certain percentage of the fair market value that is determined by local assessors to be the total taxable value of land and additions on the property. | Land | Improvement |
|---|---|---|---|---|
| 2025 | $4,064 | $808,600 | $300,400 | $508,200 |
| 2024 | $4,064 | $776,300 | $289,300 | $487,000 |
| 2023 | $4,045 | $767,000 | $265,300 | $501,700 |
| 2022 | $4,257 | $779,600 | $260,100 | $519,500 |
| 2021 | $3,656 | $572,000 | $245,100 | $326,900 |
| 2020 | $3,520 | $522,100 | $215,000 | $307,100 |
| 2019 | $3,638 | $527,200 | $215,000 | $312,200 |
| 2016 | $3,467 | $478,000 | $180,700 | $297,300 |
Source: Public Records
Map
Nearby Homes
- 633 E Vandalay Ln
- 847 E Willow Springs Ln
- 902 E 12650 S
- 12959 S Fort St
- 352 E Mistilake Ln Unit 20
- 834 E 12085 S
- 12062 S 540 E
- 311 E Unchartered Ln
- 13208 Sunset Glen Way
- 13160 S 300 E
- 224 E Spencer Peak Way Unit F-4
- 208 Spencer Peak Way Unit E2
- 1187 E Parkstone Dr
- 13176 Day Ct
- 12161 S Spring Ridge Cir
- 13216 S Telemark Ln
- 265 E 13275 S
- 1285 Manfield Way
- 181 Mountain Peak Dr
- 12525 S 1300 E
- 12662 S 700 E
- 12678 S Whisper Spring Cove
- 12678 Whisper Spring Cove
- 12677 Whisper Spring Cove
- 12690 S 700 E
- 12673 Whisper Brook Bay
- 12673 S Whisper Brook Bay
- 12657 Whisper Brook Bay
- 12657 S Whisper Brook Bay
- 12689 Whisper Brook Bay
- 12691 Whisper Spring Cove
- 12646 S 700 E
- 12689 S Whisper Brook Bay
- 12696 S Whisper Spring Cove
- 12696 Whisper Spring Cove
- 12641 S Whisper Brook Bay
- 12641 Whisper Brook Bay
- 12703 Whisper Brook Bay
- 12703 Whisper Spring Cove
- 12703 S Whisper Spring Cove
Your Personal Tour Guide
Ask me questions while you tour the home.