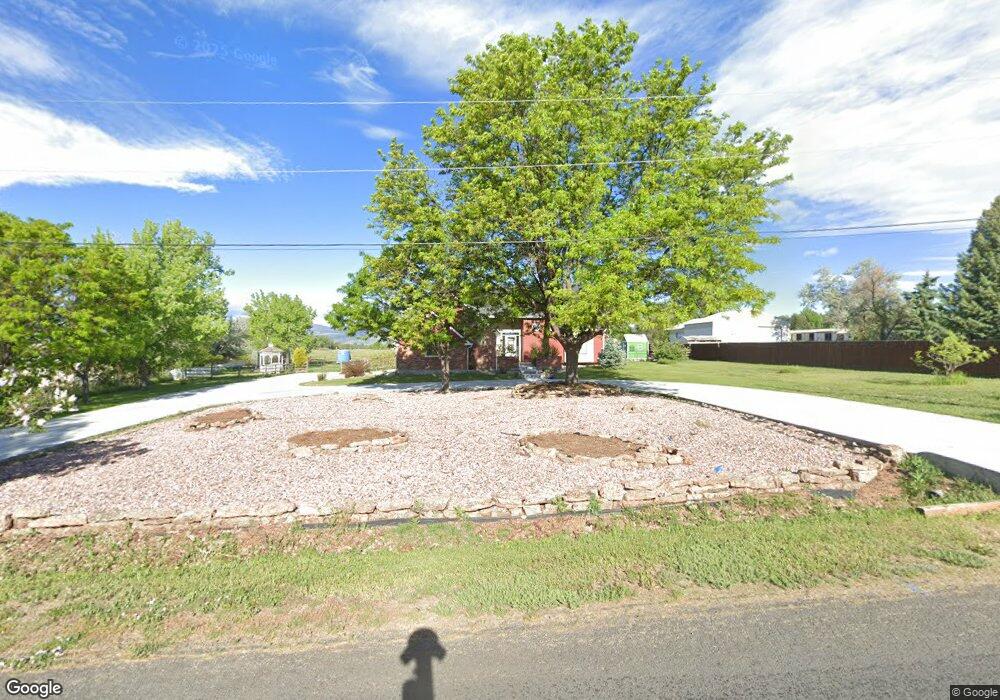
12675 Anhawa Ave Longmont, CO 80503
Estimated Value: $984,000 - $1,302,000
3
Beds
4
Baths
2,192
Sq Ft
$507/Sq Ft
Est. Value
About This Home
This home is located at 12675 Anhawa Ave, Longmont, CO 80503 and is currently estimated at $1,111,504, approximately $507 per square foot. 12675 Anhawa Ave is a home located in Boulder County with nearby schools including Hygiene Elementary School, Westview Middle School, and Longmont High School.
Ownership History
Date
Name
Owned For
Owner Type
Purchase Details
Closed on
May 27, 2015
Sold by
Ghiglia Ruthann and Ghiglia Dennis C
Bought by
Ghiglia Daniel C
Current Estimated Value
Home Financials for this Owner
Home Financials are based on the most recent Mortgage that was taken out on this home.
Original Mortgage
$536,300
Outstanding Balance
$392,456
Interest Rate
2.28%
Mortgage Type
Seller Take Back
Estimated Equity
$719,048
Purchase Details
Closed on
Aug 1, 1997
Sold by
Annette Ladehoff Frederick L and Annette Bettye
Bought by
Ghiglia Ruthann
Home Financials for this Owner
Home Financials are based on the most recent Mortgage that was taken out on this home.
Original Mortgage
$252,000
Interest Rate
6.62%
Purchase Details
Closed on
Sep 24, 1993
Sold by
James Richard E and James Alice
Bought by
Ladehoff Frederick L
Purchase Details
Closed on
Aug 24, 1990
Bought by
Ghiglia Daniel C and Ghiglia Amber L
Purchase Details
Closed on
Sep 29, 1988
Bought by
Ghiglia Daniel C and Ghiglia Amber L
Create a Home Valuation Report for This Property
The Home Valuation Report is an in-depth analysis detailing your home's value as well as a comparison with similar homes in the area
Home Values in the Area
Average Home Value in this Area
Purchase History
| Date | Buyer | Sale Price | Title Company |
|---|---|---|---|
| Ghiglia Daniel C | $536,300 | Guardian Title Agency Llc | |
| Ghiglia Ruthann | $315,000 | First American Heritage Titl | |
| Ladehoff Frederick L | $245,000 | -- | |
| Ghiglia Daniel C | $37,000 | -- | |
| Ghiglia Daniel C | -- | -- |
Source: Public Records
Mortgage History
| Date | Status | Borrower | Loan Amount |
|---|---|---|---|
| Open | Ghiglia Daniel C | $536,300 | |
| Closed | Ghiglia Ruthann | $252,000 |
Source: Public Records
Tax History Compared to Growth
Tax History
| Year | Tax Paid | Tax Assessment Tax Assessment Total Assessment is a certain percentage of the fair market value that is determined by local assessors to be the total taxable value of land and additions on the property. | Land | Improvement |
|---|---|---|---|---|
| 2025 | $7,412 | $72,281 | $23,931 | $48,350 |
| 2024 | $7,412 | $72,281 | $23,931 | $48,350 |
| 2023 | $7,286 | $77,104 | $13,990 | $66,799 |
| 2022 | $5,639 | $57,400 | $12,830 | $44,570 |
| 2021 | $5,651 | $59,052 | $13,199 | $45,853 |
| 2020 | $4,744 | $50,744 | $15,158 | $35,586 |
| 2019 | $4,664 | $50,744 | $15,158 | $35,586 |
| 2018 | $4,317 | $47,261 | $15,264 | $31,997 |
| 2017 | $4,207 | $52,249 | $16,875 | $35,374 |
| 2016 | $4,269 | $47,481 | $17,512 | $29,969 |
| 2015 | $3,262 | $42,690 | $17,990 | $24,700 |
| 2014 | $3,457 | $42,690 | $17,990 | $24,700 |
Source: Public Records
Map
Nearby Homes
- 12682 Anhawa Ave
- 2401 Spindrift Dr Unit 120529205002
- 2912 Lake Park Way
- 2935 Bow Line Place
- 12884 Anhawa Ave
- 12788 Sheramdi St
- 2425 Willow Ln
- 2292 Spinnaker Cir
- 3119 Lake Park Way
- 3132 Concord Way
- 2421 Maplewood Cir W
- 2410 Maplewood Cir W
- 3125 Concord Way
- 3142 Captains Ln
- 13205 N 87th St
- 9458 Anhawa Ave
- 2634 Westlake Ct
- 2191 Steele St
- 2078 Goldfinch Ct
- 2124 Kay St
- 12729 Anhawa Ave
- 12648 Anhawa Ave
- 9111 Jotipa Dr
- 9057 Ute Hwy
- 12777 Anhawa Ave
- 9114 Jotipa Dr
- 12624 Anhawa Ave
- 9117 Ute Hwy
- 9119 Jotipa Dr
- 9126 Jotipa Dr
- 9129 Ute Hwy
- 9133 Jotipa Dr
- 9126 Fleetwood Ave
- 9132 Jotipa Dr
- 9106 Fleetwood Ave
- 2832 Bow Line Place
- 2838 Bow Line Place
- 9148 Fleetwood Ave
- 2900 Bow Line Place
- 9141 Ute Hwy