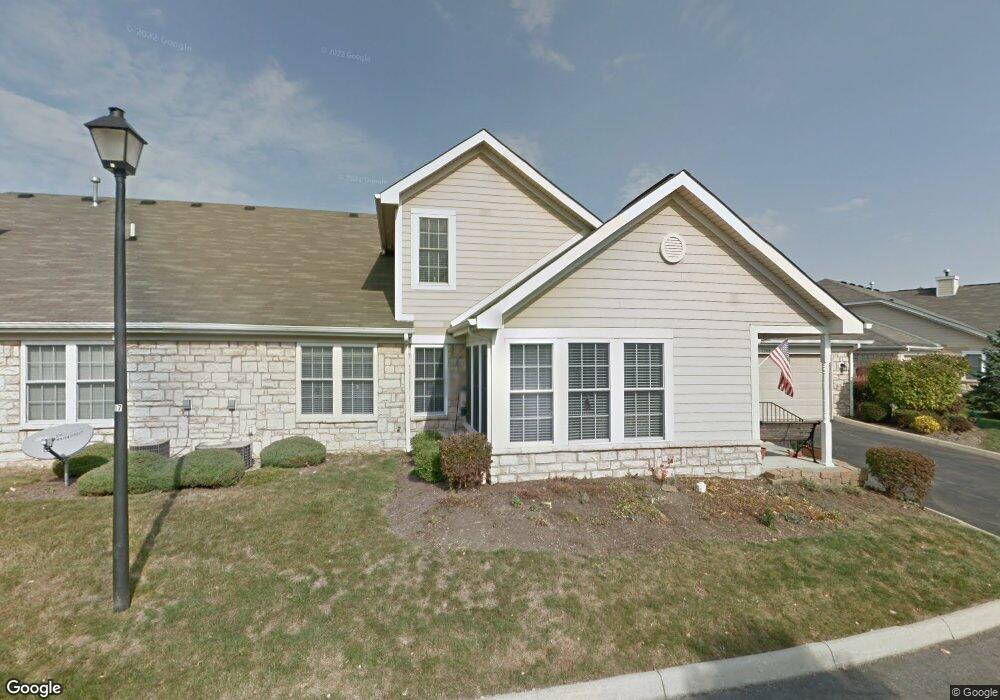
1268 Winningham Ln Unit 1268 Columbus, OH 43240
Polaris North NeighborhoodEstimated Value: $329,281 - $376,000
3
Beds
2
Baths
1,845
Sq Ft
$191/Sq Ft
Est. Value
About This Home
This home is located at 1268 Winningham Ln Unit 1268, Columbus, OH 43240 and is currently estimated at $353,070, approximately $191 per square foot. 1268 Winningham Ln Unit 1268 is a home located in Delaware County with nearby schools including Freedom Trail Elementary School, Olentangy Orange Middle School, and Orange High School.
Ownership History
Date
Name
Owned For
Owner Type
Purchase Details
Closed on
Oct 14, 2020
Sold by
Mcgarvey Pamela A and Mcgarvey Phyllis A
Bought by
Shepherd William R
Current Estimated Value
Home Financials for this Owner
Home Financials are based on the most recent Mortgage that was taken out on this home.
Original Mortgage
$200,000
Interest Rate
2.96%
Mortgage Type
New Conventional
Purchase Details
Closed on
Jan 25, 2006
Sold by
Mcgarvey Roy B and Mcgarvey Phyllis A
Bought by
Mcgarvey Phyllis A
Purchase Details
Closed on
Apr 25, 2005
Sold by
The Woods At Polaris Llc
Bought by
Mcgarvey Roy B and Mcgarvey Phyllis A
Home Financials for this Owner
Home Financials are based on the most recent Mortgage that was taken out on this home.
Original Mortgage
$151,900
Interest Rate
5.37%
Mortgage Type
Purchase Money Mortgage
Create a Home Valuation Report for This Property
The Home Valuation Report is an in-depth analysis detailing your home's value as well as a comparison with similar homes in the area
Home Values in the Area
Average Home Value in this Area
Purchase History
| Date | Buyer | Sale Price | Title Company |
|---|---|---|---|
| Shepherd William R | $252,000 | Bridge Title & Escrow | |
| Mcgarvey Phyllis A | -- | None Available | |
| Mcgarvey Roy B | $189,900 | -- |
Source: Public Records
Mortgage History
| Date | Status | Borrower | Loan Amount |
|---|---|---|---|
| Previous Owner | Shepherd William R | $200,000 | |
| Previous Owner | Mcgarvey Roy B | $151,900 |
Source: Public Records
Tax History Compared to Growth
Tax History
| Year | Tax Paid | Tax Assessment Tax Assessment Total Assessment is a certain percentage of the fair market value that is determined by local assessors to be the total taxable value of land and additions on the property. | Land | Improvement |
|---|---|---|---|---|
| 2024 | $5,531 | $101,570 | $18,200 | $83,370 |
| 2023 | $5,552 | $101,570 | $18,200 | $83,370 |
| 2022 | $5,238 | $78,020 | $14,700 | $63,320 |
| 2021 | $5,267 | $78,020 | $14,700 | $63,320 |
| 2020 | $4,702 | $78,020 | $14,700 | $63,320 |
| 2019 | $3,593 | $63,740 | $12,250 | $51,490 |
| 2018 | $3,609 | $63,740 | $12,250 | $51,490 |
| 2017 | $3,207 | $53,270 | $10,500 | $42,770 |
| 2016 | $3,111 | $53,270 | $10,500 | $42,770 |
| 2015 | $2,842 | $53,270 | $10,500 | $42,770 |
| 2014 | $2,883 | $53,270 | $10,500 | $42,770 |
| 2013 | $3,130 | $56,000 | $10,500 | $45,500 |
Source: Public Records
Map
Nearby Homes
- 9182 Gramford St Unit 9182
- 9146 Gramford St Unit 9146
- 9168 Tahoma St
- 1746 E Powell Rd
- 8322 Aurora Ct
- 2251 Tucker Trail
- 2715 Tucker Trail
- 975 Adara Dr Unit 6975
- 1627 Bristol Commons Place
- 2216 Reeves Ave
- 3138 E Powell Rd
- 1923 Myrtle St
- 7631 Pleasant Colony Ct
- 2165 Ben Brush Place
- 1520 Aniko Ave
- 758 Parkgrove Way Unit 758
- 8749 Paulden Ct
- 738 Parkbluff Way Unit 738
- 2160 Pleasant Colony Dr
- 2363 Pleasant Colony Dr
- 1271 Allington Ln Unit 1271
- 1264 Winningham Ln Unit 1264
- 1267 Allington Ln Unit 1267
- 1277 Winningham Ln Unit 1277
- 1287 Allington Ln Unit 1287
- 1284 Winningham Ln Unit 1284
- 1273 Winningham Ln Unit 1273
- 1261 Winningham Ln Unit 1261
- 1281 Winningham Ln Unit 1281
- 1270 Allington Ln Unit 1270
- 1274 Allington Ln Unit 1274
- 1291 Allington Ln Unit 1291
- 1288 Winningham Ln Unit 1288
- 1257 Winningham Ln Unit 1257
- 1285 Winningham Ln Unit 1285
- 1266 Allington Ln Unit 1266
- 1265 Winningham Ln Unit 1265
- 1253 Winningham Ln Unit 1253
- 1290 Allington Ln Unit 1290
- 1297 Winningham Ln Unit 1297