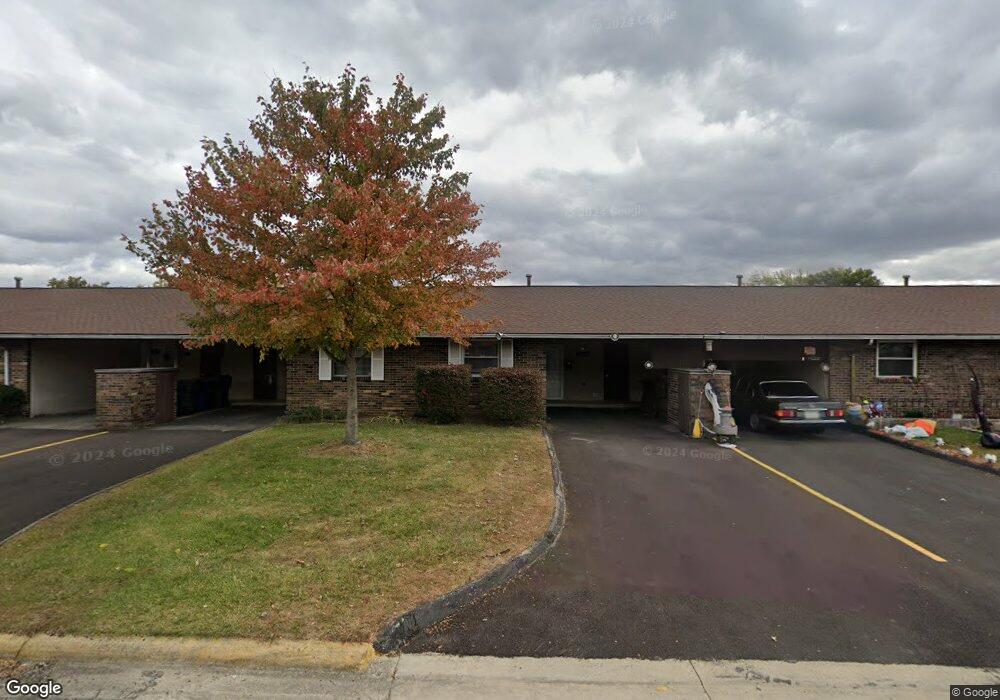
1268 Woodbrook Cir W Columbus, OH 43223
Brookshire NeighborhoodEstimated Value: $73,558 - $86,000
1
Bed
1
Bath
718
Sq Ft
$112/Sq Ft
Est. Value
About This Home
This home is located at 1268 Woodbrook Cir W, Columbus, OH 43223 and is currently estimated at $80,390, approximately $111 per square foot. 1268 Woodbrook Cir W is a home located in Franklin County with nearby schools including Lindbergh Elementary School, Hilltonia Middle School, and Briggs High School.
Ownership History
Date
Name
Owned For
Owner Type
Purchase Details
Closed on
Feb 1, 2016
Sold by
Sims Melissa K and Sims Ryan T
Bought by
Sims City Properties Llc
Current Estimated Value
Home Financials for this Owner
Home Financials are based on the most recent Mortgage that was taken out on this home.
Original Mortgage
$9,000
Outstanding Balance
$7,186
Interest Rate
4%
Mortgage Type
New Conventional
Estimated Equity
$73,204
Purchase Details
Closed on
Jan 27, 2016
Sold by
Mundy Abby
Bought by
Sims City Properties Llc
Home Financials for this Owner
Home Financials are based on the most recent Mortgage that was taken out on this home.
Original Mortgage
$9,000
Outstanding Balance
$7,186
Interest Rate
4%
Mortgage Type
New Conventional
Estimated Equity
$73,204
Purchase Details
Closed on
Dec 24, 1991
Bought by
Briggs J Richard
Purchase Details
Closed on
Feb 13, 1991
Purchase Details
Closed on
Jan 1, 1984
Create a Home Valuation Report for This Property
The Home Valuation Report is an in-depth analysis detailing your home's value as well as a comparison with similar homes in the area
Home Values in the Area
Average Home Value in this Area
Purchase History
| Date | Buyer | Sale Price | Title Company |
|---|---|---|---|
| Sims City Properties Llc | -- | None Available | |
| Sims City Properties Llc | $9,000 | None Available | |
| Briggs J Richard | -- | -- | |
| -- | -- | -- | |
| -- | -- | -- |
Source: Public Records
Mortgage History
| Date | Status | Borrower | Loan Amount |
|---|---|---|---|
| Open | Sims City Properties Llc | $9,000 |
Source: Public Records
Tax History Compared to Growth
Tax History
| Year | Tax Paid | Tax Assessment Tax Assessment Total Assessment is a certain percentage of the fair market value that is determined by local assessors to be the total taxable value of land and additions on the property. | Land | Improvement |
|---|---|---|---|---|
| 2024 | $996 | $21,740 | $5,250 | $16,490 |
| 2023 | $984 | $21,740 | $5,250 | $16,490 |
| 2022 | $534 | $10,050 | $1,540 | $8,510 |
| 2021 | $535 | $10,050 | $1,540 | $8,510 |
| 2020 | $536 | $10,050 | $1,540 | $8,510 |
| 2019 | $499 | $8,020 | $1,230 | $6,790 |
| 2018 | $471 | $8,020 | $1,230 | $6,790 |
| 2017 | $493 | $8,020 | $1,230 | $6,790 |
| 2016 | $488 | $7,180 | $1,300 | $5,880 |
| 2015 | $444 | $7,180 | $1,300 | $5,880 |
| 2014 | $445 | $7,180 | $1,300 | $5,880 |
| 2013 | $244 | $7,980 | $1,435 | $6,545 |
Source: Public Records
Map
Nearby Homes
- 1258 Woodbrook Cir W Unit 199
- 2336 Woodbrook Cir N Unit 92 B
- 1119 Hardesty Place E Unit 1
- 2382 Hardesty Dr S Unit Q-5
- 1085 Hardesty Place E Unit 4
- 2436 Hardesty Dr S Unit 4
- 2337 Hardesty Ct Unit 1
- 0 S Central Ave
- 2547 Rosedale Ave
- 2322 Hardesty Ct Unit I11
- 2334 Hardesty Ct Unit 5
- 2367 Hardesty Dr N Unit 1-1
- 2210 October Ridge Dr
- 2180 Eakin Rd
- 1543 Red Leaf Ln
- 2610 Spaatz Ave
- 2491 Vanderberg Ave
- 1607 Red Leaf Ln
- 2530 Vanderberg Ave
- 2538 Vanderberg Ave
- 1266 Woodbrook Cir W Unit 203
- 1270 Woodbrook Cir W Unit 205
- 1264 Woodbrook Cir W Unit 202
- 1262 Woodbrook Cir W Unit 201
- 1301 Woodbrook Ln
- 1299 Woodbrook Ln
- 1299 Woodbrook Ln Unit 225
- 1297 Woodbrook Ln
- 1260 Woodbrook Cir W Unit 200
- 1295 Woodbrook Ln Unit 223
- 1217 Woodbrook Cir W
- 1217 Woodbrook Cir W
- 1273 Woodbrook Cir W Unit 9
- 1269 Woodbrook Cir W
- 1293 Woodbrook Ln
- 1275 Woodbrook Cir W
- 1267 Woodbrook Cir W Unit 12
- 1279 Woodbrook Ln Unit 214
- 1279 Woodbrook Ln Unit 213
- 1279 Woodbrook Ln Unit 210