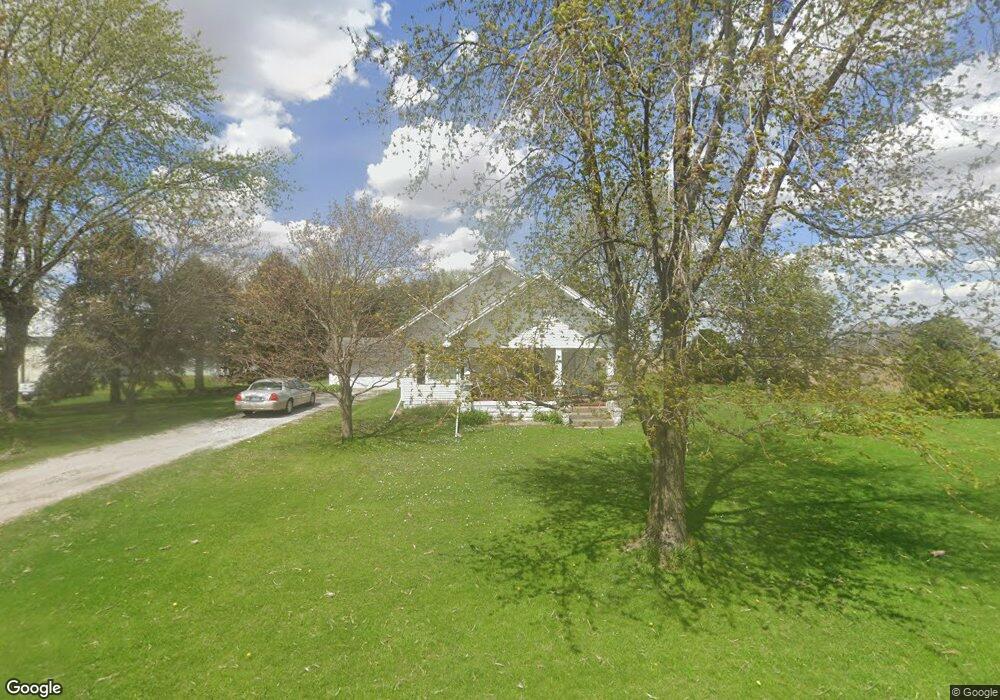
12684 E 200 N Greentown, IN 46936
Estimated Value: $247,000 - $428,595
2
Beds
1
Bath
1,059
Sq Ft
$313/Sq Ft
Est. Value
About This Home
This home is located at 12684 E 200 N, Greentown, IN 46936 and is currently estimated at $331,198, approximately $312 per square foot. 12684 E 200 N is a home located in Howard County with nearby schools including Eastern Elementary School and Eastern High School.
Ownership History
Date
Name
Owned For
Owner Type
Purchase Details
Closed on
May 9, 2025
Sold by
Jarrard Sherrill A and Hackenbracht Jo E
Bought by
Renbarger Richard B and Renbarger Patty L
Current Estimated Value
Purchase Details
Closed on
Oct 23, 2020
Sold by
Hackenbracht Jo E
Bought by
Hubler Daniel P
Purchase Details
Closed on
Jun 17, 2020
Sold by
Hackenbracht Kenneth L
Bought by
Jarrard Sherrill A and Hackenbracht Jo E
Create a Home Valuation Report for This Property
The Home Valuation Report is an in-depth analysis detailing your home's value as well as a comparison with similar homes in the area
Purchase History
| Date | Buyer | Sale Price | Title Company |
|---|---|---|---|
| Renbarger Richard B | $160,000 | None Listed On Document | |
| Hubler Daniel P | -- | Butcher Ball Lowry Mcmahan & M | |
| Jarrard Sherrill A | -- | -- |
Source: Public Records
Tax History
| Year | Tax Paid | Tax Assessment Tax Assessment Total Assessment is a certain percentage of the fair market value that is determined by local assessors to be the total taxable value of land and additions on the property. | Land | Improvement |
|---|---|---|---|---|
| 2025 | $6,459 | $162,000 | $29,000 | $133,000 |
| 2024 | $5,939 | $328,100 | $204,800 | $123,300 |
| 2022 | $5,311 | $260,800 | $144,200 | $116,600 |
| 2021 | $4,521 | $221,200 | $126,300 | $94,900 |
| 2020 | $3,113 | $216,800 | $125,500 | $91,300 |
| 2019 | $3,386 | $232,200 | $147,300 | $84,900 |
| 2018 | $3,692 | $236,100 | $151,200 | $84,900 |
| 2017 | $4,009 | $250,300 | $167,400 | $82,900 |
| 2016 | $4,078 | $251,600 | $176,000 | $75,600 |
| 2014 | $4,070 | $260,900 | $182,900 | $78,000 |
| 2013 | $3,592 | $234,100 | $160,400 | $73,700 |
Source: Public Records
Map
Nearby Homes
- 1263 N 1350 E
- 11766 E 100 N
- 207 W Lincoln St
- 203 E Lyons St
- 9095 E 00 Ns
- 718 E Walnut St
- 1009 Eastcrest Dr
- 529 Uncle Tom St
- 524 E Grant St
- 533 E Main St
- 228 E Railroad St
- 218 N Howard St
- 329 E Lincoln St
- 40 Howard St
- 37 Howard St
- 105 W Wabash St
- 317 Harrison Ct
- 506 S Harrison St
- 213 W Water St
- 12631 E 300 S
Your Personal Tour Guide
Ask me questions while you tour the home.