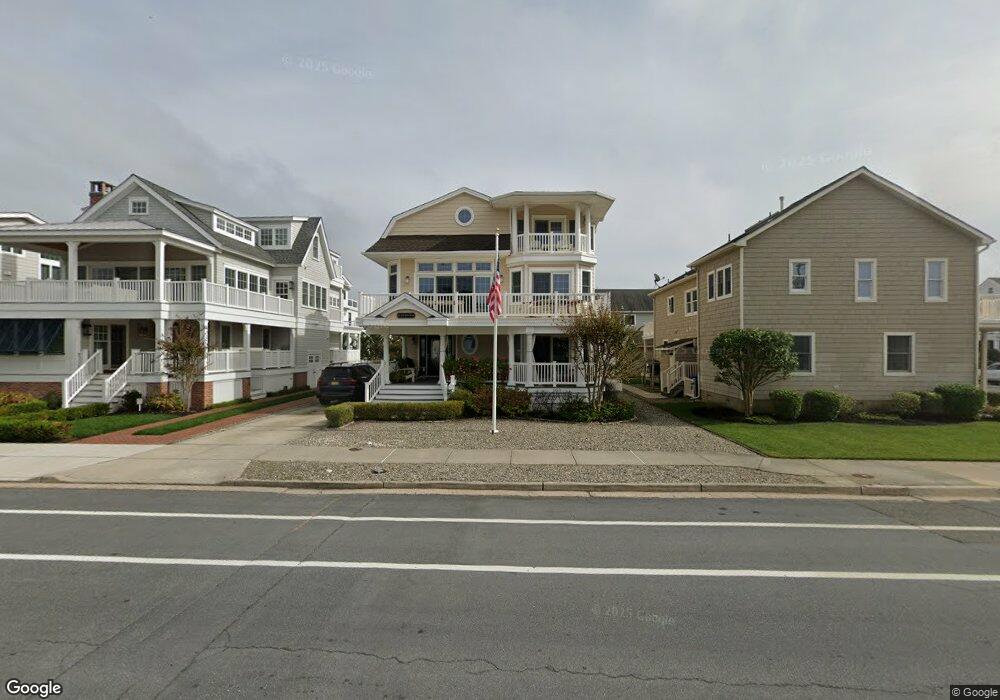
1269 Avalon Ave Avalon, NJ 08202
Estimated Value: $4,255,776 - $5,066,000
--
Bed
--
Bath
3,740
Sq Ft
$1,272/Sq Ft
Est. Value
About This Home
This home is located at 1269 Avalon Ave, Avalon, NJ 08202 and is currently estimated at $4,756,194, approximately $1,271 per square foot. 1269 Avalon Ave is a home located in Cape May County with nearby schools including Avalon Elementary School.
Ownership History
Date
Name
Owned For
Owner Type
Purchase Details
Closed on
Nov 26, 2014
Sold by
Pound Leo J and Pound Sonja Sandholm
Bought by
Felker David J and Falk Amy S
Current Estimated Value
Home Financials for this Owner
Home Financials are based on the most recent Mortgage that was taken out on this home.
Original Mortgage
$284,250
Outstanding Balance
$218,215
Interest Rate
3.98%
Mortgage Type
Credit Line Revolving
Estimated Equity
$4,537,980
Purchase Details
Closed on
Feb 20, 2003
Sold by
Mannino Edward F
Bought by
Pound Leo J and Pound Sonja Sandholm
Home Financials for this Owner
Home Financials are based on the most recent Mortgage that was taken out on this home.
Original Mortgage
$640,000
Interest Rate
5.98%
Purchase Details
Closed on
Aug 27, 1990
Sold by
Mannino Edward F and Mannino Mary A
Bought by
Mannino Edward F and Mannino Mary A
Create a Home Valuation Report for This Property
The Home Valuation Report is an in-depth analysis detailing your home's value as well as a comparison with similar homes in the area
Home Values in the Area
Average Home Value in this Area
Purchase History
| Date | Buyer | Sale Price | Title Company |
|---|---|---|---|
| Felker David J | $1,895,000 | Seaboard Title Agency | |
| Pound Leo J | $800,000 | -- | |
| Mannino Edward F | -- | -- |
Source: Public Records
Mortgage History
| Date | Status | Borrower | Loan Amount |
|---|---|---|---|
| Open | Felker David J | $284,250 | |
| Open | Felker David J | $1,326,500 | |
| Previous Owner | Pound Leo J | $640,000 |
Source: Public Records
Tax History Compared to Growth
Tax History
| Year | Tax Paid | Tax Assessment Tax Assessment Total Assessment is a certain percentage of the fair market value that is determined by local assessors to be the total taxable value of land and additions on the property. | Land | Improvement |
|---|---|---|---|---|
| 2025 | $14,982 | $2,440,100 | $1,450,000 | $990,100 |
| 2024 | $14,982 | $2,440,100 | $1,450,000 | $990,100 |
| 2023 | $14,860 | $2,440,100 | $1,450,000 | $990,100 |
| 2022 | $13,860 | $2,440,100 | $1,450,000 | $990,100 |
| 2021 | $13,347 | $2,440,100 | $1,450,000 | $990,100 |
| 2020 | $12,835 | $2,440,100 | $1,450,000 | $990,100 |
| 2019 | $12,445 | $2,440,100 | $1,450,000 | $990,100 |
| 2018 | $11,908 | $2,440,100 | $1,450,000 | $990,100 |
| 2017 | $12,235 | $2,200,500 | $1,300,000 | $900,500 |
| 2016 | $12,103 | $2,200,500 | $1,300,000 | $900,500 |
| 2015 | $11,905 | $2,200,500 | $1,300,000 | $900,500 |
| 2014 | $11,773 | $2,200,500 | $1,300,000 | $900,500 |
Source: Public Records
Map
Nearby Homes