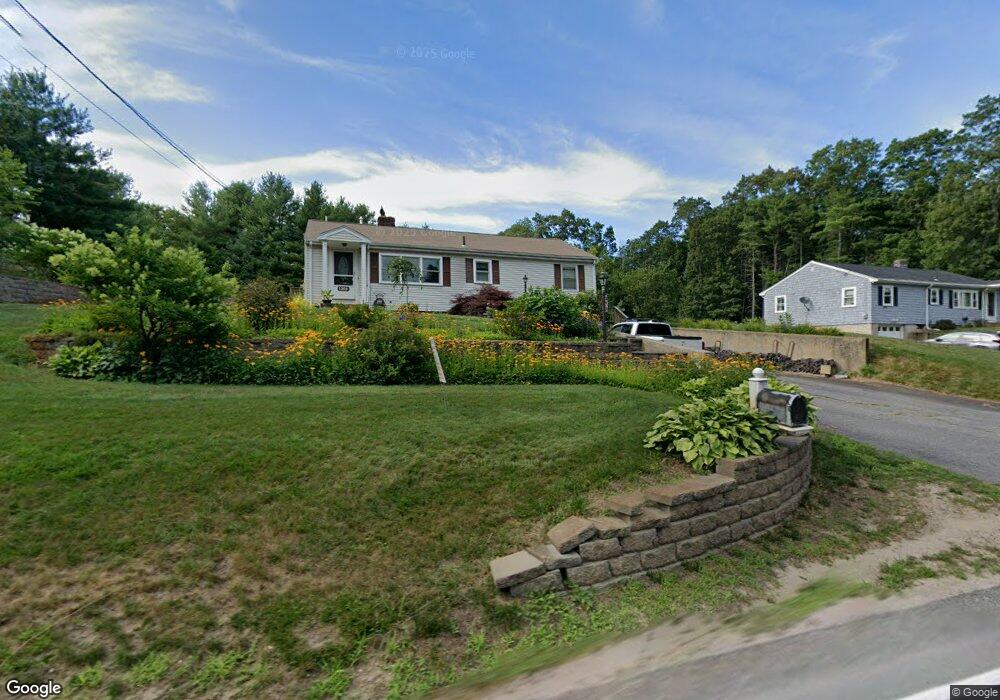
1269 Broadway Hanover, MA 02339
Estimated Value: $599,565 - $722,000
2
Beds
1
Bath
1,144
Sq Ft
$579/Sq Ft
Est. Value
About This Home
This home is located at 1269 Broadway, Hanover, MA 02339 and is currently estimated at $662,891, approximately $579 per square foot. 1269 Broadway is a home located in Plymouth County with nearby schools including Hanover High School, Cadence Academy Preschool - Hanover, and Cardinal Cushing Centers.
Ownership History
Date
Name
Owned For
Owner Type
Purchase Details
Closed on
Jul 11, 2013
Sold by
Gilmartin Scott P
Bought by
Gilmartin Scott P and Gilmartin Mary M
Current Estimated Value
Home Financials for this Owner
Home Financials are based on the most recent Mortgage that was taken out on this home.
Original Mortgage
$197,800
Outstanding Balance
$142,344
Interest Rate
3.83%
Mortgage Type
New Conventional
Estimated Equity
$520,547
Purchase Details
Closed on
Oct 29, 2010
Sold by
Patt Deborah L and Huff Joseph F
Bought by
Gilmartin Scott P
Home Financials for this Owner
Home Financials are based on the most recent Mortgage that was taken out on this home.
Original Mortgage
$198,400
Interest Rate
4.39%
Mortgage Type
Purchase Money Mortgage
Create a Home Valuation Report for This Property
The Home Valuation Report is an in-depth analysis detailing your home's value as well as a comparison with similar homes in the area
Home Values in the Area
Average Home Value in this Area
Purchase History
| Date | Buyer | Sale Price | Title Company |
|---|---|---|---|
| Gilmartin Scott P | -- | -- | |
| Gilmartin Scott P | -- | -- | |
| Gilmartin Scott P | -- | -- | |
| Gilmartin Scott P | $248,000 | -- | |
| Gilmartin Scott P | $248,000 | -- |
Source: Public Records
Mortgage History
| Date | Status | Borrower | Loan Amount |
|---|---|---|---|
| Open | Gilmartin Scott P | $197,800 | |
| Closed | Gilmartin Scott P | $197,800 | |
| Previous Owner | Gilmartin Scott P | $198,400 | |
| Previous Owner | Gilmartin Scott P | $25,000 |
Source: Public Records
Tax History Compared to Growth
Tax History
| Year | Tax Paid | Tax Assessment Tax Assessment Total Assessment is a certain percentage of the fair market value that is determined by local assessors to be the total taxable value of land and additions on the property. | Land | Improvement |
|---|---|---|---|---|
| 2025 | $6,679 | $540,800 | $269,200 | $271,600 |
| 2024 | $6,944 | $540,800 | $269,200 | $271,600 |
| 2023 | $6,373 | $472,400 | $244,800 | $227,600 |
| 2022 | $6,442 | $422,400 | $244,800 | $177,600 |
| 2021 | $4,063 | $395,400 | $222,500 | $172,900 |
| 2020 | $6,372 | $390,700 | $222,500 | $168,200 |
| 2019 | $14,771 | $371,800 | $222,500 | $149,300 |
| 2018 | $8,842 | $365,600 | $222,500 | $143,100 |
| 2017 | $3,069 | $339,000 | $209,100 | $129,900 |
| 2016 | $5,395 | $320,000 | $190,100 | $129,900 |
| 2015 | $4,923 | $304,800 | $190,100 | $114,700 |
Source: Public Records
Map
Nearby Homes
- 1251 Broadway
- 41 Gail Rd
- Lot 22 Adams Cir
- 553 Center St
- 436 Center St
- 842 E Washington St
- 15 Elm Place
- 154 Winter St
- 114 Graham Hill Dr
- 51 Cervelli Farm Dr
- 37 Dr
- 23 Cervelli Farm Dr
- 38 Cervelli Farm Dr
- 9 Cervelli Farm Dr
- 250 Center St
- 37 Brook St
- 67 School St
- 418 E Washington St
- 21 King St
- 456 Gorwin Dr