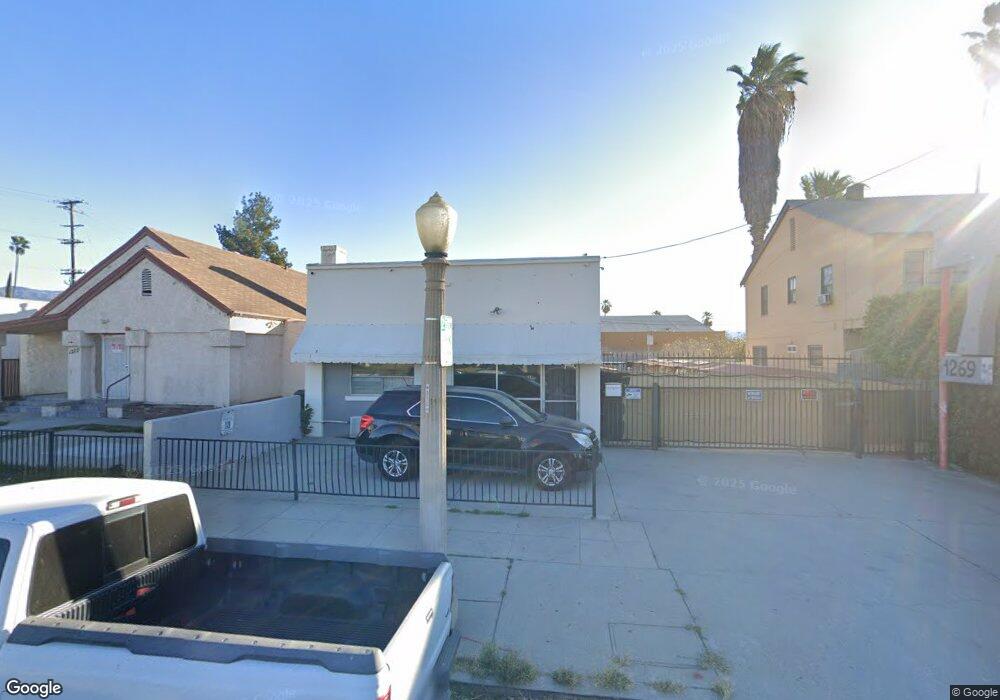
1269 N D St San Bernardino, CA 92405
SBHS NeighborhoodEstimated Value: $448,587
--
Bed
--
Bath
1,788
Sq Ft
$251/Sq Ft
Est. Value
About This Home
This home is located at 1269 N D St, San Bernardino, CA 92405 and is currently estimated at $448,587, approximately $250 per square foot. 1269 N D St is a home located in San Bernardino County with nearby schools including Lincoln Elementary School, Arrowview Middle School, and San Bernardino High School.
Ownership History
Date
Name
Owned For
Owner Type
Purchase Details
Closed on
May 12, 2020
Sold by
Aguilar Ariselda O Rodriguez De
Bought by
Aguilar Jose Jesus
Current Estimated Value
Home Financials for this Owner
Home Financials are based on the most recent Mortgage that was taken out on this home.
Original Mortgage
$224,250
Outstanding Balance
$198,717
Interest Rate
3.3%
Mortgage Type
Commercial
Estimated Equity
$252,651
Purchase Details
Closed on
Oct 2, 2019
Sold by
Kahros Kostadinos and Kamar Athina
Bought by
Kahros Kostadinos and Kamar Athina
Purchase Details
Closed on
Jun 24, 2004
Sold by
Brimmer Donald and The Lorne E Brimmer Family Tru
Bought by
Kahros Kostadinos and Kahros Athina
Purchase Details
Closed on
Feb 18, 2004
Sold by
Brimmer Lorne E
Bought by
Brimmer Lorne E and Lorne E Brimmer Family Trust
Create a Home Valuation Report for This Property
The Home Valuation Report is an in-depth analysis detailing your home's value as well as a comparison with similar homes in the area
Home Values in the Area
Average Home Value in this Area
Purchase History
| Date | Buyer | Sale Price | Title Company |
|---|---|---|---|
| Aguilar Jose Jesus | -- | Fidelity National Title | |
| Aguilar Jose Jesus | $299,000 | None Available | |
| Kahros Kostadinos | -- | None Available | |
| Kahros Kostadinos | $65,000 | Gateway Title | |
| Brimmer Lorne E | -- | -- |
Source: Public Records
Mortgage History
| Date | Status | Borrower | Loan Amount |
|---|---|---|---|
| Open | Aguilar Jose Jesus | $224,250 |
Source: Public Records
Tax History Compared to Growth
Tax History
| Year | Tax Paid | Tax Assessment Tax Assessment Total Assessment is a certain percentage of the fair market value that is determined by local assessors to be the total taxable value of land and additions on the property. | Land | Improvement |
|---|---|---|---|---|
| 2025 | $4,164 | $327,000 | $64,524 | $262,476 |
| 2024 | $4,164 | $320,588 | $63,259 | $257,329 |
| 2023 | $4,061 | $314,302 | $62,019 | $252,283 |
| 2022 | $4,068 | $308,139 | $60,803 | $247,336 |
| 2021 | $4,076 | $302,097 | $59,611 | $242,486 |
| 2020 | $1,254 | $82,847 | $19,118 | $63,729 |
| 2019 | $1,220 | $81,222 | $18,743 | $62,479 |
| 2018 | $1,208 | $79,629 | $18,375 | $61,254 |
| 2017 | $1,171 | $78,068 | $18,015 | $60,053 |
| 2016 | $1,136 | $76,537 | $17,662 | $58,875 |
| 2015 | $1,006 | $75,388 | $17,397 | $57,991 |
| 2014 | $978 | $73,911 | $17,056 | $56,855 |
Source: Public Records
Map
Nearby Homes
- 1305 N D St
- 381 W Wabash St
- 1346 N D St
- 1137 N Mayfield Ave
- 1372 N E St
- 1330 Acacia Ave
- 464 W 14th St
- 427 Magnolia Ave
- 156 W Wabash St
- 1525 N Arrowhead Ave
- 1064 Acacia Ave
- 1550 N Pershing Ave
- 1305 N Sierra Way
- 1323 N G St
- 1319 N Sierra Way
- 1572 N Stoddard Ave
- 1001 N Mountain View Ave
- 636 W Olive St
- 664 W 14th St
- 642 W Olive St