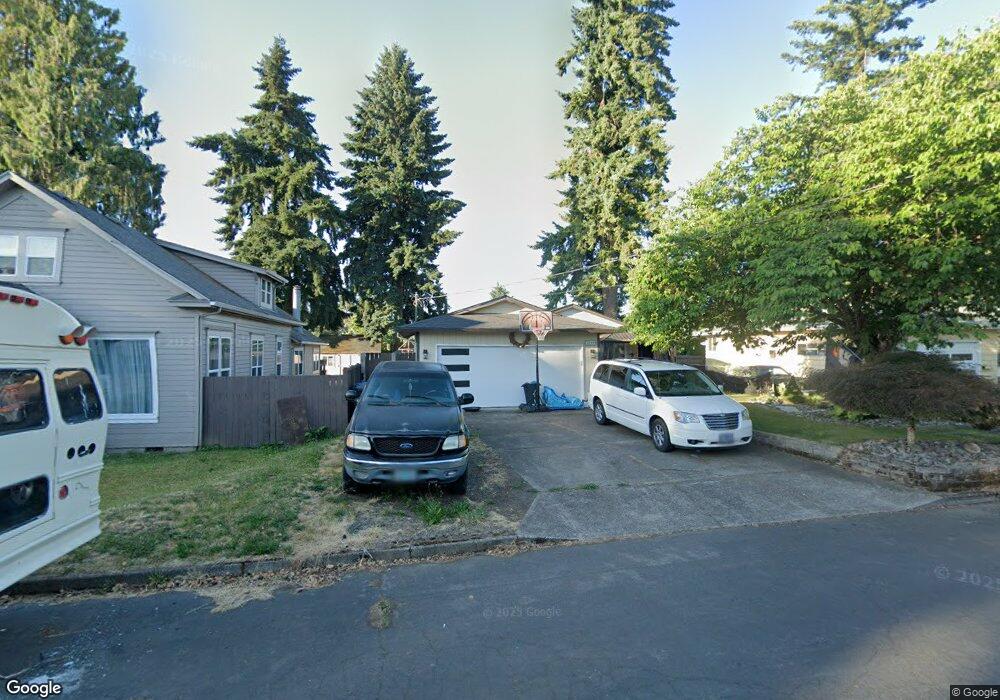
1269 S Beech St Cornelius, OR 97113
Estimated Value: $414,000 - $437,000
4
Beds
2
Baths
1,344
Sq Ft
$316/Sq Ft
Est. Value
About This Home
This home is located at 1269 S Beech St, Cornelius, OR 97113 and is currently estimated at $424,236, approximately $315 per square foot. 1269 S Beech St is a home located in Washington County with nearby schools including Echo Shaw Elementary School, Neil Armstrong Middle School, and Tom McCall Upper Elementary School.
Ownership History
Date
Name
Owned For
Owner Type
Purchase Details
Closed on
Jul 25, 2013
Sold by
Baca Jason M and Baca Melissa R
Bought by
Baca Jason M and Baca Melissa R
Current Estimated Value
Home Financials for this Owner
Home Financials are based on the most recent Mortgage that was taken out on this home.
Original Mortgage
$144,384
Outstanding Balance
$103,887
Interest Rate
3.75%
Mortgage Type
FHA
Estimated Equity
$320,349
Purchase Details
Closed on
Apr 28, 2009
Sold by
Us Bank National Association
Bought by
Baca Jason M and Poole Melissa R
Home Financials for this Owner
Home Financials are based on the most recent Mortgage that was taken out on this home.
Original Mortgage
$153,174
Interest Rate
4.99%
Mortgage Type
FHA
Purchase Details
Closed on
Feb 27, 2006
Sold by
Rodriguez Macedonio Torres and Lopez Sonia
Bought by
Ornelas Jorge Avila
Home Financials for this Owner
Home Financials are based on the most recent Mortgage that was taken out on this home.
Original Mortgage
$159,600
Interest Rate
8.55%
Mortgage Type
Fannie Mae Freddie Mac
Create a Home Valuation Report for This Property
The Home Valuation Report is an in-depth analysis detailing your home's value as well as a comparison with similar homes in the area
Purchase History
| Date | Buyer | Sale Price | Title Company |
|---|---|---|---|
| Baca Jason M | -- | Mortgage Information Svcs | |
| Baca Jason M | $156,000 | Fatco | |
| Ornelas Jorge Avila | $199,500 | First American |
Source: Public Records
Mortgage History
| Date | Status | Borrower | Loan Amount |
|---|---|---|---|
| Open | Baca Jason M | $144,384 | |
| Closed | Baca Jason M | $153,174 | |
| Previous Owner | Ornelas Jorge Avila | $159,600 |
Source: Public Records
Tax History
| Year | Tax Paid | Tax Assessment Tax Assessment Total Assessment is a certain percentage of the fair market value that is determined by local assessors to be the total taxable value of land and additions on the property. | Land | Improvement |
|---|---|---|---|---|
| 2026 | $3,130 | $180,150 | -- | -- |
| 2025 | $3,130 | $174,910 | -- | -- |
| 2024 | $2,859 | $169,820 | -- | -- |
| 2023 | $2,859 | $164,880 | $0 | $0 |
| 2022 | $2,533 | $164,880 | $0 | $0 |
| 2021 | $2,503 | $155,420 | $0 | $0 |
| 2020 | $2,493 | $150,900 | $0 | $0 |
| 2019 | $2,439 | $146,510 | $0 | $0 |
| 2018 | $2,364 | $142,250 | $0 | $0 |
| 2017 | $2,291 | $138,110 | $0 | $0 |
| 2016 | $2,226 | $134,090 | $0 | $0 |
| 2015 | $2,095 | $130,190 | $0 | $0 |
| 2014 | $2,023 | $126,400 | $0 | $0 |
Source: Public Records
Map
Nearby Homes
- 122 S 12th Ave
- 1701 S Alpine St
- 302 S 19th Ave
- 493 S Emerald Loop
- 1100 S Ivy St
- 1214 N Clark St
- 328 N 15th Ave
- 715 S 8th Ave
- 597 S Fawn St
- 43 S 20th Ave
- 570 N 10th St Unit 29
- 570 N 10th Ave Unit 2
- 570 N 10th Ave Unit 6
- 570 N 10th Ave Unit 110
- 333 N 19th Ave
- 2120 S Dogwood St
- 1959 S Heather St
- 507 N 19th Ave Unit 99
- 507 N 19th Ave Unit 18
- 507 N 19th Ave Unit 1
- 1289 S Beech St
- 1239 S Beech St
- 1266 S Cherry St
- 1213 S Beech St
- 275 S 13th Ave
- 1244 S Cherry St
- 1313 S Beech St
- 1266 S Beech St
- 1210 S Cherry St
- 1240 S Beech St
- 1290 S Beech St
- 1322 S Cherry St
- 1329 S Beech St
- 1212 S Beech St
- 1341 S Beech St
- 1316 S Beech St
- 168 S 12th Ave
- 1179 S Beech St
- 1365 S Beech St
- 1352 S Cherry St
Your Personal Tour Guide
Ask me questions while you tour the home.