Estimated Value: $758,000 - $980,000
3
Beds
3
Baths
1,898
Sq Ft
$453/Sq Ft
Est. Value
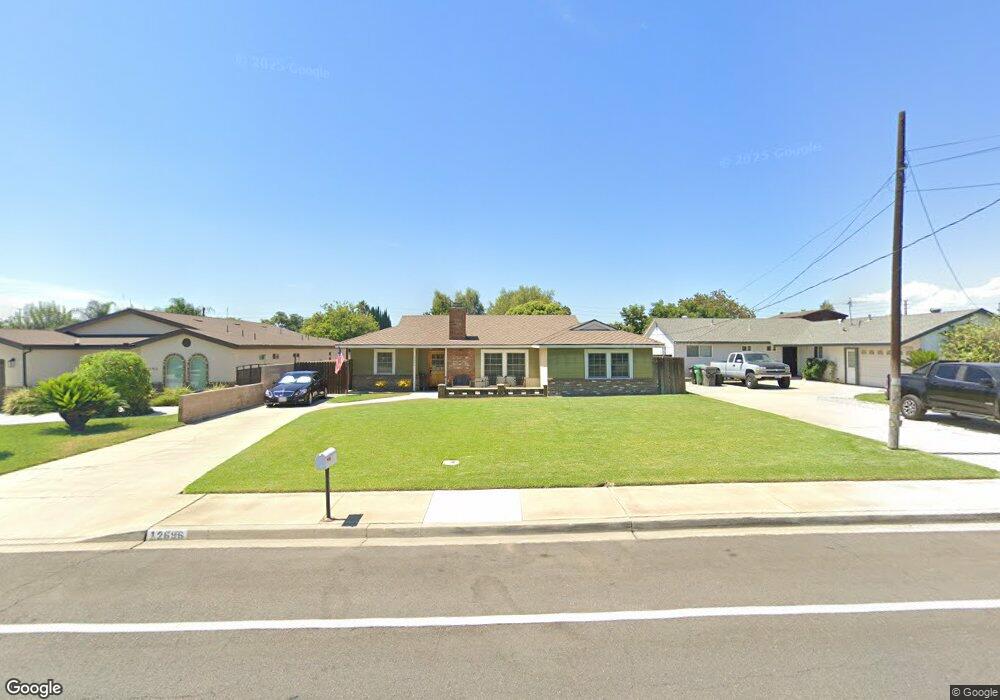
About This Home
This home is located at 12696 Ross Ave, Chino, CA 91710 and is currently estimated at $860,173, approximately $453 per square foot. 12696 Ross Ave is a home located in San Bernardino County with nearby schools including Alicia Cortez Elementary, Magnolia Junior High, and Chino High School.
Ownership History
Date
Name
Owned For
Owner Type
Purchase Details
Closed on
Jul 8, 2025
Sold by
Garcia Efrain M
Bought by
Garcia Efrain M and Garcia Rosa I
Current Estimated Value
Purchase Details
Closed on
Jun 20, 2011
Sold by
Mercado Rosa I
Bought by
Garcia Efrain M
Home Financials for this Owner
Home Financials are based on the most recent Mortgage that was taken out on this home.
Original Mortgage
$240,000
Interest Rate
4.56%
Mortgage Type
New Conventional
Purchase Details
Closed on
Mar 28, 2002
Sold by
Wallace Caron P and Wallace Linda E
Bought by
Prescott Jeffrey J and Prescott Renay L
Home Financials for this Owner
Home Financials are based on the most recent Mortgage that was taken out on this home.
Original Mortgage
$253,800
Interest Rate
7.13%
Purchase Details
Closed on
Jan 11, 1995
Sold by
Bale Paul William
Bought by
Wallace Caron P and Wallace Linda E
Create a Home Valuation Report for This Property
The Home Valuation Report is an in-depth analysis detailing your home's value as well as a comparison with similar homes in the area
Home Values in the Area
Average Home Value in this Area
Purchase History
| Date | Buyer | Sale Price | Title Company |
|---|---|---|---|
| Garcia Efrain M | -- | None Listed On Document | |
| Garcia Efrain M | -- | Lawyers Title | |
| Garcia Efrain M | $300,000 | Lawyers Title | |
| Prescott Jeffrey J | $282,000 | Fidelity National Title Ins | |
| Wallace Caron P | $111,000 | Northern Counties Title |
Source: Public Records
Mortgage History
| Date | Status | Borrower | Loan Amount |
|---|---|---|---|
| Previous Owner | Garcia Efrain M | $240,000 | |
| Previous Owner | Prescott Jeffrey J | $253,800 |
Source: Public Records
Tax History
| Year | Tax Paid | Tax Assessment Tax Assessment Total Assessment is a certain percentage of the fair market value that is determined by local assessors to be the total taxable value of land and additions on the property. | Land | Improvement |
|---|---|---|---|---|
| 2025 | $4,216 | $384,355 | $134,525 | $249,830 |
| 2024 | $4,102 | $376,818 | $131,887 | $244,931 |
| 2023 | $3,987 | $369,429 | $129,301 | $240,128 |
| 2022 | $3,962 | $362,186 | $126,766 | $235,420 |
| 2021 | $3,884 | $355,084 | $124,280 | $230,804 |
| 2020 | $3,833 | $351,443 | $123,006 | $228,437 |
| 2019 | $3,764 | $344,552 | $120,594 | $223,958 |
| 2018 | $3,680 | $337,796 | $118,229 | $219,567 |
| 2017 | $3,613 | $331,173 | $115,911 | $215,262 |
| 2016 | $3,375 | $324,679 | $113,638 | $211,041 |
| 2015 | $3,306 | $319,802 | $111,931 | $207,871 |
| 2014 | $3,240 | $313,537 | $109,738 | $203,799 |
Source: Public Records
Map
Nearby Homes
- 12644 Oaks Ave
- 12524 Ross Ave
- 5925 Riverside Dr Unit 12
- 12446 Chestnut Place
- 6221 Garfield St
- 12951 Benson Ave Unit 142
- 12321 Gardenia Place
- 12737 Carob Ct
- 12346 Cedar Ave
- 5963 Rosario St
- 2321 S Magnolia Ave Unit 12 C
- 13185 14th St
- 12400 Cypress Ave Unit 45
- 12997 Falcon Place
- 0 C St
- 1106 W Philadelphia St
- 5513 D St
- 13284 Cypress Ave
- 926 W Philadelphia St Unit Q93
- 2046 S Mountain Ave
Your Personal Tour Guide
Ask me questions while you tour the home.