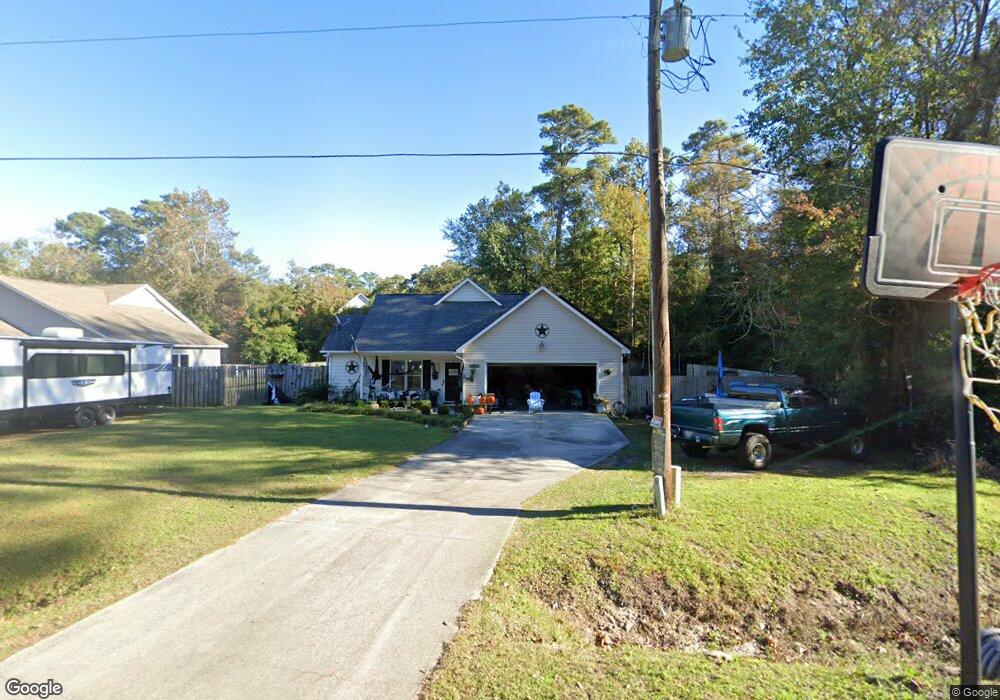
127 E Brandywine Cir Wilmington, NC 28411
Estimated Value: $354,000 - $480,000
2
Beds
2
Baths
1,605
Sq Ft
$247/Sq Ft
Est. Value
About This Home
This home is located at 127 E Brandywine Cir, Wilmington, NC 28411 and is currently estimated at $397,207, approximately $247 per square foot. 127 E Brandywine Cir is a home located in New Hanover County with nearby schools including Ogden Elementary School, M.C.S. Noble Middle School, and Emsley A. Laney High School.
Ownership History
Date
Name
Owned For
Owner Type
Purchase Details
Closed on
Apr 15, 2016
Sold by
Mckinney Jason K and Mckinney Stefannie
Bought by
Brown Krista M
Current Estimated Value
Home Financials for this Owner
Home Financials are based on the most recent Mortgage that was taken out on this home.
Original Mortgage
$162,011
Outstanding Balance
$131,061
Interest Rate
4.25%
Mortgage Type
FHA
Estimated Equity
$266,146
Purchase Details
Closed on
Feb 29, 2000
Sold by
Joseph Albert Valade Inc
Bought by
Mckinney Jason J
Purchase Details
Closed on
May 26, 1999
Sold by
Todd Tommy L Elaine F
Bought by
Joseph Albert Valade Inc
Purchase Details
Closed on
Aug 21, 1996
Sold by
New Han Cnty
Bought by
Todd Tommy L Elaine F
Purchase Details
Closed on
Apr 30, 1996
Sold by
Todd Tommy L Elaine F
Bought by
New Han Cnty Water/Sewer
Purchase Details
Closed on
Dec 1, 1988
Sold by
Browning John L Virginia L
Bought by
Todd Tommy L Elaine F
Create a Home Valuation Report for This Property
The Home Valuation Report is an in-depth analysis detailing your home's value as well as a comparison with similar homes in the area
Home Values in the Area
Average Home Value in this Area
Purchase History
| Date | Buyer | Sale Price | Title Company |
|---|---|---|---|
| Brown Krista M | $165,000 | None Available | |
| Mckinney Jason J | $120,000 | -- | |
| Joseph Albert Valade Inc | $100,000 | -- | |
| Todd Tommy L Elaine F | -- | -- | |
| New Han Cnty Water/Sewer | -- | -- | |
| Todd Tommy L Elaine F | $2,000 | -- |
Source: Public Records
Mortgage History
| Date | Status | Borrower | Loan Amount |
|---|---|---|---|
| Open | Brown Krista M | $162,011 |
Source: Public Records
Tax History
| Year | Tax Paid | Tax Assessment Tax Assessment Total Assessment is a certain percentage of the fair market value that is determined by local assessors to be the total taxable value of land and additions on the property. | Land | Improvement |
|---|---|---|---|---|
| 2025 | $1,520 | $382,100 | $126,400 | $255,700 |
| 2023 | $1,750 | $322,000 | $71,700 | $250,300 |
| 2022 | $1,766 | $322,000 | $71,700 | $250,300 |
| 2021 | $1,775 | $322,000 | $71,700 | $250,300 |
| 2020 | $1,112 | $175,800 | $50,100 | $125,700 |
| 2019 | $1,112 | $175,800 | $50,100 | $125,700 |
| 2018 | $1,112 | $175,800 | $50,100 | $125,700 |
| 2017 | $1,138 | $175,800 | $50,100 | $125,700 |
| 2016 | $1,195 | $172,400 | $61,800 | $110,600 |
| 2015 | $1,110 | $172,400 | $61,800 | $110,600 |
| 2014 | $1,091 | $172,400 | $61,800 | $110,600 |
Source: Public Records
Map
Nearby Homes
- 3533 Middle Sound Loop Rd
- 133 Ludlow Dr
- 202 W Bedford Rd
- 7124 Maple Leaf Dr
- 7106 Haven Way
- 633 Countryside Ln
- 900 Middle Sound Loop Rd
- 6422 Serena Ct
- 7609 Hawk Rd
- 6509 Old Fort Rd
- 3027 Hayden Dr
- 247 Bloomington Ln
- 625 Dundee Dr
- 1106 Boone Ln
- 313 Lord Dr
- 207 Vistamar Dr
- 233 Buff Cir
- 342 Lord Dr
- 218 Wagon Wheel Way
- 7109 Rock Creek Cir
- 123 E Brandywine Cir
- 129 E Brandywine Cir
- 119 E Brandywine Cir
- 3509 Whimsy Way
- 122 E Brandywine Cir
- 3500 Whimsy Way
- 110 E Brandywine Cir
- 117 E Brandywine Cir
- 117 W Brandywine Cir
- 126 E Brandywine Cir
- 6705 Piedmont Place
- 142 Homestead Ct
- 156 Homestead Ct
- 113 E Brandywine Cir
- 102 E Brandywine Cir
- 6700 Piedmont Place
- 130 E Brandywine Cir
- 138 Homestead Ct
- 6709 Piedmont Place
- 3413 Whimsy Way
Your Personal Tour Guide
Ask me questions while you tour the home.