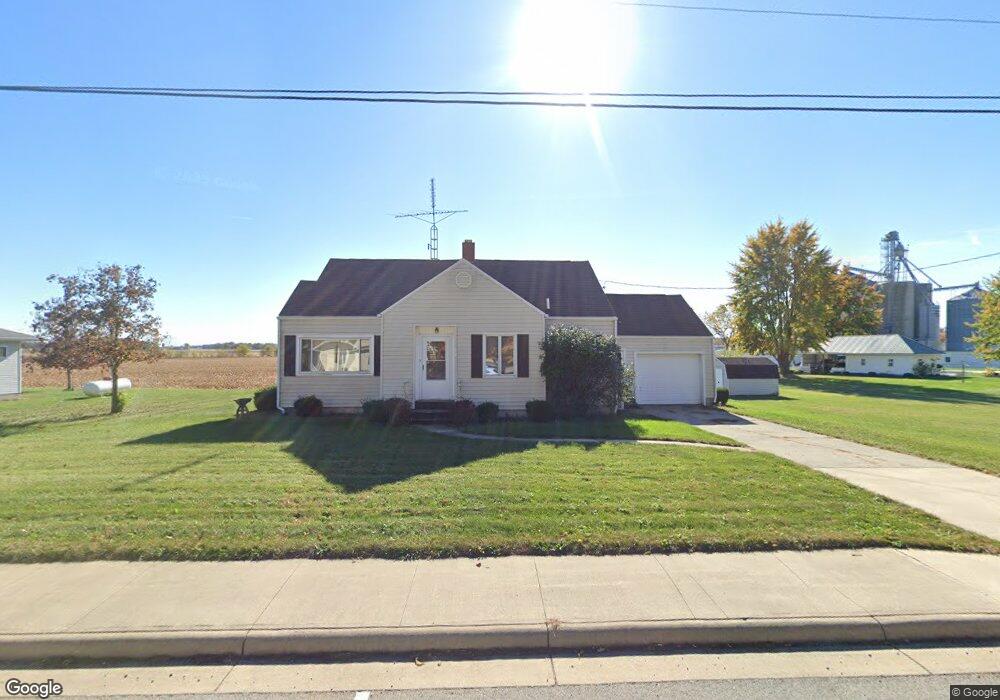
127 E Main St Osgood, OH 45351
Estimated Value: $215,702 - $295,000
3
Beds
2
Baths
1,527
Sq Ft
$162/Sq Ft
Est. Value
About This Home
This home is located at 127 E Main St, Osgood, OH 45351 and is currently estimated at $247,176, approximately $161 per square foot. 127 E Main St is a home with nearby schools including Marion Local Elementary School and Marion Local High School.
Ownership History
Date
Name
Owned For
Owner Type
Purchase Details
Closed on
Oct 11, 2017
Sold by
Stueve Janelle L and Thobe Janelle L
Bought by
Stueve Jason A
Current Estimated Value
Home Financials for this Owner
Home Financials are based on the most recent Mortgage that was taken out on this home.
Original Mortgage
$98,300
Interest Rate
3.78%
Mortgage Type
New Conventional
Purchase Details
Closed on
Sep 5, 2014
Sold by
Winner Loretta and Roetgerman Rebecca A
Bought by
Stueve Jason A and Thobe Janelle L
Home Financials for this Owner
Home Financials are based on the most recent Mortgage that was taken out on this home.
Original Mortgage
$102,150
Interest Rate
3.75%
Mortgage Type
Adjustable Rate Mortgage/ARM
Create a Home Valuation Report for This Property
The Home Valuation Report is an in-depth analysis detailing your home's value as well as a comparison with similar homes in the area
Purchase History
| Date | Buyer | Sale Price | Title Company |
|---|---|---|---|
| Stueve Jason A | -- | None Available | |
| Stueve Jason A | $170,250 | Attorney |
Source: Public Records
Mortgage History
| Date | Status | Borrower | Loan Amount |
|---|---|---|---|
| Closed | Stueve Jason A | $98,300 | |
| Closed | Stueve Jason A | $102,150 |
Source: Public Records
Tax History
| Year | Tax Paid | Tax Assessment Tax Assessment Total Assessment is a certain percentage of the fair market value that is determined by local assessors to be the total taxable value of land and additions on the property. | Land | Improvement |
|---|---|---|---|---|
| 2025 | $2,271 | $50,100 | $8,480 | $41,620 |
| 2024 | $2,271 | $50,100 | $8,480 | $41,620 |
| 2023 | $1,830 | $50,100 | $8,480 | $41,620 |
| 2022 | $1,616 | $43,200 | $7,210 | $35,990 |
| 2021 | $1,646 | $43,200 | $7,210 | $35,990 |
| 2020 | $1,651 | $43,200 | $7,210 | $35,990 |
| 2019 | $1,398 | $36,000 | $7,210 | $28,790 |
| 2018 | $1,457 | $36,000 | $7,210 | $28,790 |
| 2017 | $1,477 | $36,000 | $7,210 | $28,790 |
| 2016 | $1,456 | $36,660 | $7,270 | $29,390 |
| 2015 | $1,456 | $36,660 | $7,270 | $29,390 |
| 2014 | $840 | $29,840 | $7,270 | $22,570 |
| 2013 | $851 | $27,790 | $7,270 | $20,520 |
Source: Public Records
Map
Nearby Homes
Your Personal Tour Guide
Ask me questions while you tour the home.