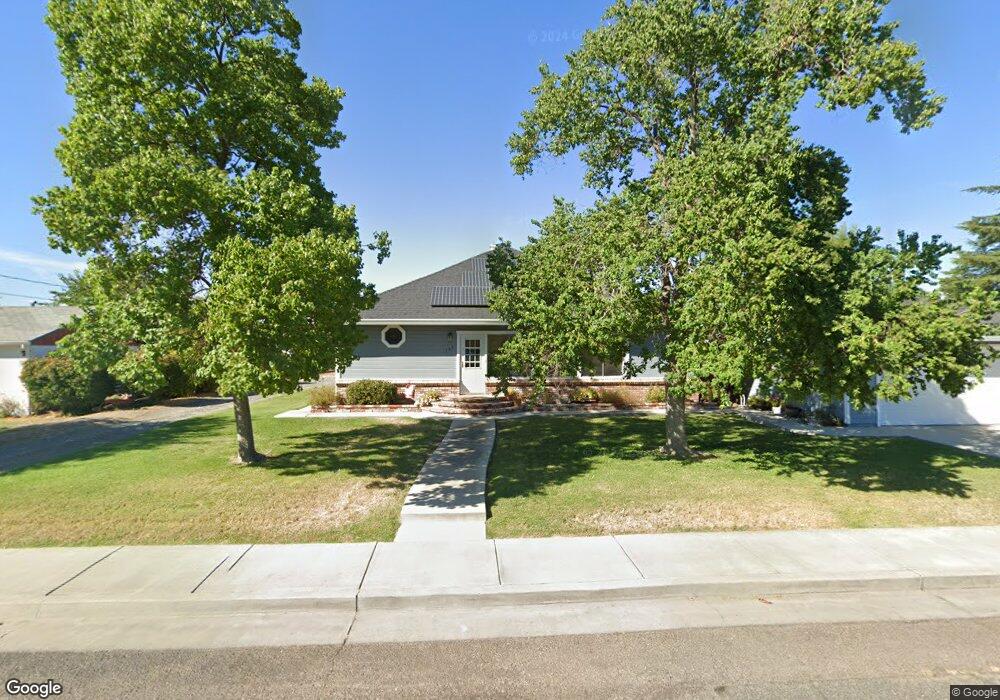
127 E Yolo St Orland, CA 95963
Estimated Value: $369,282 - $405,000
7
Beds
5
Baths
3,042
Sq Ft
$128/Sq Ft
Est. Value
About This Home
This home is located at 127 E Yolo St, Orland, CA 95963 and is currently estimated at $389,071, approximately $127 per square foot. 127 E Yolo St is a home located in Glenn County with nearby schools including Fairview Elementary School, Mill Street Elementary School, and Price Intermediate School.
Ownership History
Date
Name
Owned For
Owner Type
Purchase Details
Closed on
Oct 29, 2015
Sold by
Lazorko Sharon L
Bought by
The Sharon Lynn Lazorko Revocable Trust
Current Estimated Value
Purchase Details
Closed on
Oct 29, 2008
Sold by
Lazorko Sharon L
Bought by
Sharon Lynn Lazorko Revocable Trust
Purchase Details
Closed on
Nov 27, 2006
Sold by
Lazorko Sharon L
Bought by
Lazorko Sharon L
Purchase Details
Closed on
Jul 25, 1997
Sold by
Jones Theodore R and Jones Edith A
Bought by
Lazorko Sharon L
Create a Home Valuation Report for This Property
The Home Valuation Report is an in-depth analysis detailing your home's value as well as a comparison with similar homes in the area
Purchase History
| Date | Buyer | Sale Price | Title Company |
|---|---|---|---|
| The Sharon Lynn Lazorko Revocable Trust | -- | None Available | |
| Sharon Lynn Lazorko Revocable Trust | -- | None Available | |
| Lazorko Sharon L | -- | North State Title Company | |
| Lazorko Sharon L | -- | First American Title Ins Co |
Source: Public Records
Tax History
| Year | Tax Paid | Tax Assessment Tax Assessment Total Assessment is a certain percentage of the fair market value that is determined by local assessors to be the total taxable value of land and additions on the property. | Land | Improvement |
|---|---|---|---|---|
| 2025 | $1,350 | $127,827 | $38,015 | $89,812 |
| 2024 | $1,350 | $125,321 | $37,270 | $88,051 |
| 2023 | $1,315 | $122,865 | $36,540 | $86,325 |
| 2022 | $1,291 | $120,457 | $35,824 | $84,633 |
| 2021 | $1,288 | $118,096 | $35,122 | $82,974 |
| 2020 | $1,287 | $116,886 | $34,762 | $82,124 |
| 2019 | $1,276 | $114,595 | $34,081 | $80,514 |
| 2018 | $1,193 | $112,349 | $33,413 | $78,936 |
| 2017 | $1,235 | $110,147 | $32,758 | $77,389 |
| 2016 | $1,160 | $107,988 | $32,116 | $75,872 |
| 2015 | $1,142 | $106,367 | $31,634 | $74,733 |
| 2014 | $1,119 | $104,285 | $31,015 | $73,270 |
Source: Public Records
Map
Nearby Homes
Your Personal Tour Guide
Ask me questions while you tour the home.