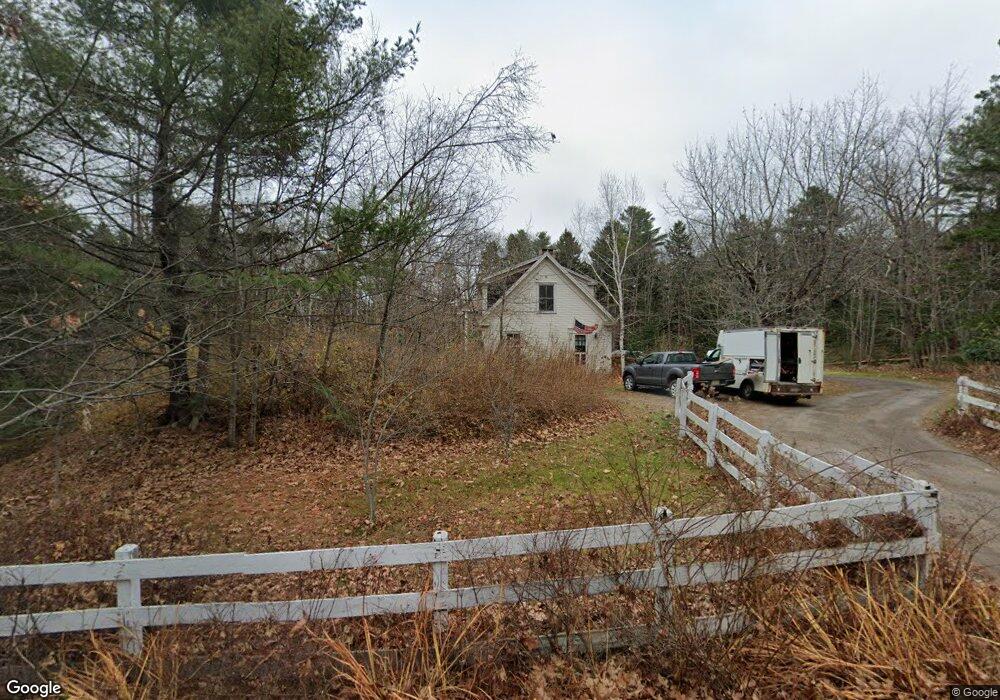
127 Flying Point Rd Freeport, ME 04032
Estimated Value: $986,000 - $1,333,000
3
Beds
3
Baths
2,389
Sq Ft
$486/Sq Ft
Est. Value
About This Home
This home is located at 127 Flying Point Rd, Freeport, ME 04032 and is currently estimated at $1,161,196, approximately $486 per square foot. 127 Flying Point Rd is a home located in Cumberland County with nearby schools including Morse Street School, Mast Landing School, and Freeport Middle School.
Ownership History
Date
Name
Owned For
Owner Type
Purchase Details
Closed on
Jan 5, 2007
Sold by
Carhart Bartley R and Carhart Mary L
Bought by
South Freeport Lnd Co Llc
Current Estimated Value
Home Financials for this Owner
Home Financials are based on the most recent Mortgage that was taken out on this home.
Original Mortgage
$150,000
Outstanding Balance
$53,998
Interest Rate
6.24%
Mortgage Type
Unknown
Estimated Equity
$1,107,198
Create a Home Valuation Report for This Property
The Home Valuation Report is an in-depth analysis detailing your home's value as well as a comparison with similar homes in the area
Home Values in the Area
Average Home Value in this Area
Purchase History
| Date | Buyer | Sale Price | Title Company |
|---|---|---|---|
| South Freeport Lnd Co Llc | -- | -- |
Source: Public Records
Mortgage History
| Date | Status | Borrower | Loan Amount |
|---|---|---|---|
| Open | South Freeport Lnd Co Llc | $150,000 | |
| Closed | South Freeport Lnd Co Llc | $188,000 |
Source: Public Records
Tax History Compared to Growth
Tax History
| Year | Tax Paid | Tax Assessment Tax Assessment Total Assessment is a certain percentage of the fair market value that is determined by local assessors to be the total taxable value of land and additions on the property. | Land | Improvement |
|---|---|---|---|---|
| 2024 | $10,167 | $761,600 | $166,500 | $595,100 |
| 2023 | $7,777 | $565,600 | $151,400 | $414,200 |
| 2022 | $7,531 | $551,700 | $137,500 | $414,200 |
| 2021 | $7,365 | $551,700 | $137,500 | $414,200 |
| 2020 | $7,235 | $516,800 | $127,500 | $389,300 |
| 2019 | $6,956 | $486,400 | $120,300 | $366,100 |
| 2018 | $6,843 | $454,700 | $112,100 | $342,600 |
| 2017 | $6,523 | $436,300 | $109,600 | $326,700 |
| 2016 | $6,328 | $400,500 | $101,500 | $299,000 |
| 2015 | $6,372 | $379,300 | $95,800 | $283,500 |
| 2014 | $5,993 | $379,300 | $95,800 | $283,500 |
| 2013 | $5,842 | $368,600 | $92,400 | $276,200 |
Source: Public Records
Map
Nearby Homes
- 136 Flying Point Rd
- 9 Apple Ridge Rd
- 44 Maquoit Dr
- 5 Indian Ridge Rd
- 83 Central Ave
- 71 Merganser Way
- 4 Sandy Beach Rd
- 46 Blackstone Club Rd
- 11 Orchard Hill Rd
- Lot # 4 South St
- 12 West St
- 56 S Freeport Rd
- 15 Tinkers Way
- 0 S Freeport Rd
- 1612 U S Route 1
- 853 Mere Point Rd
- 7 Lmc Ln
- 28 Harvest Ridge Rd Unit 25
- 26 Harvest Ridge Rd Unit 24
- 1260 Us Route 1
- 15 Sparrow Hill Rd
- 124 Flying Point Rd
- 124 Flying Point Rd
- 128 Flying Point Rd
- 38 Kings Timber Way
- 57 Osprey Cove Rd
- 57 Osprey Cove Ln
- 120 Flying Point Rd
- 58 Osprey Cove Ln
- 58 Osprey Cove Rd
- 45 Osprey Cove Rd
- 116 Flying Point Rd
- Lot D Sparrow Hill Rd
- 50 Osprey Cove Rd
- 11 Tumblers Hill
- 25 Sparrow Hill Rd
- 8 Tumblers Hill
- 10 Lower Flying Point Rd
- 143 Flying Point Rd
- 38 Kings Timber Way