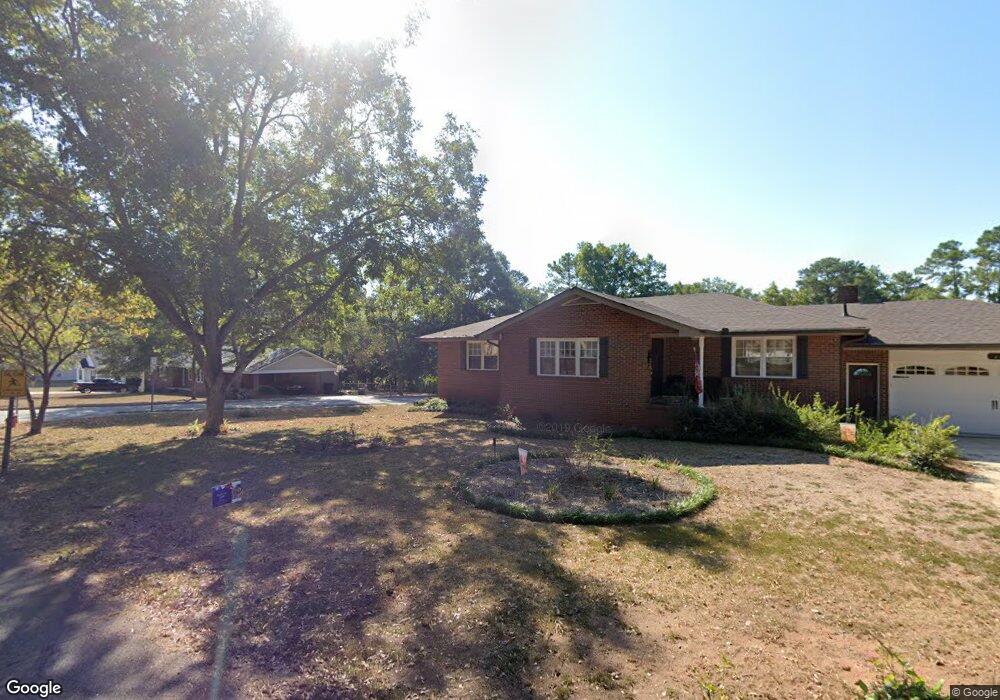
127 Gwyn St Unit 3 & 4 Zebulon, GA 30295
Estimated Value: $295,243 - $363,000
2
Beds
2
Baths
3,384
Sq Ft
$95/Sq Ft
Est. Value
About This Home
This home is located at 127 Gwyn St Unit 3 & 4, Zebulon, GA 30295 and is currently estimated at $320,561, approximately $94 per square foot. 127 Gwyn St Unit 3 & 4 is a home located in Pike County with nearby schools including Pike County Primary School, Pike County Elementary School, and Pike County Middle School.
Ownership History
Date
Name
Owned For
Owner Type
Purchase Details
Closed on
Apr 28, 2021
Sold by
Nalls Mary Jo
Bought by
Nalls Anthony Mark
Current Estimated Value
Purchase Details
Closed on
May 14, 2015
Sold by
Birney Kathleen A
Bought by
Nalls Anthony Mark and Nalls Mary Jo
Home Financials for this Owner
Home Financials are based on the most recent Mortgage that was taken out on this home.
Original Mortgage
$118,800
Interest Rate
4.13%
Mortgage Type
New Conventional
Purchase Details
Closed on
Jul 26, 2003
Sold by
Winscom Cathrine
Bought by
Birney Kathleen A
Purchase Details
Closed on
Dec 12, 1996
Sold by
Birney Robert and Birney Kathleen
Bought by
Winscom Cathrine
Purchase Details
Closed on
Mar 12, 1990
Sold by
Birney Robert
Bought by
Birney Robert and Birney Kathleen
Purchase Details
Closed on
Mar 3, 1990
Sold by
Morrison Frank
Bought by
Birney Robert
Purchase Details
Closed on
Nov 6, 1986
Bought by
Morrison Frank
Create a Home Valuation Report for This Property
The Home Valuation Report is an in-depth analysis detailing your home's value as well as a comparison with similar homes in the area
Home Values in the Area
Average Home Value in this Area
Purchase History
| Date | Buyer | Sale Price | Title Company |
|---|---|---|---|
| Nalls Anthony Mark | -- | -- | |
| Nalls Anthony Mark | $132,000 | -- | |
| Birney Kathleen A | -- | -- | |
| Winscom Cathrine | -- | -- | |
| Birney Robert | -- | -- | |
| Birney Robert | -- | -- | |
| Morrison Frank | -- | -- |
Source: Public Records
Mortgage History
| Date | Status | Borrower | Loan Amount |
|---|---|---|---|
| Previous Owner | Nalls Anthony Mark | $118,800 |
Source: Public Records
Tax History Compared to Growth
Tax History
| Year | Tax Paid | Tax Assessment Tax Assessment Total Assessment is a certain percentage of the fair market value that is determined by local assessors to be the total taxable value of land and additions on the property. | Land | Improvement |
|---|---|---|---|---|
| 2024 | $2,762 | $85,345 | $8,000 | $77,345 |
| 2023 | $3,245 | $85,932 | $8,000 | $77,932 |
| 2022 | $2,235 | $59,187 | $3,200 | $55,987 |
| 2021 | $2,216 | $59,187 | $3,200 | $55,987 |
| 2020 | $2,272 | $59,187 | $3,200 | $55,987 |
| 2019 | $1,758 | $52,834 | $3,200 | $49,634 |
| 2018 | $1,826 | $52,834 | $3,200 | $49,634 |
| 2017 | $1,811 | $52,834 | $3,200 | $49,634 |
| 2016 | $1,679 | $52,834 | $3,200 | $49,634 |
| 2015 | $1,578 | $52,082 | $3,200 | $48,882 |
| 2014 | $1,600 | $52,082 | $3,200 | $48,882 |
| 2013 | -- | $52,081 | $3,200 | $48,881 |
Source: Public Records
Map
Nearby Homes
- 274 Caldwell Rd
- 203 Pine St
- 0 US Highway 19 Unit 10432667
- 123 Griffin St
- 171 Jackson St
- 16156 Barnesville St
- 244 Wrightsburg Way
- 308 Wrightsburg Way
- 94 Wrightsburg Way
- 106 Wrightsburg Way
- 15316 Concord St
- 95 Joshua Ct
- 456 M l King jr Cir
- 1004 Mill Race Unit 4
- 1019 Mill Race Unit 19
- 1003 Mill Race Unit 3
- 1002 Mill Race Unit 2
- 98 Whitfield Bend
- 637 Whitfield Walk
- 681 Whitfield Walk