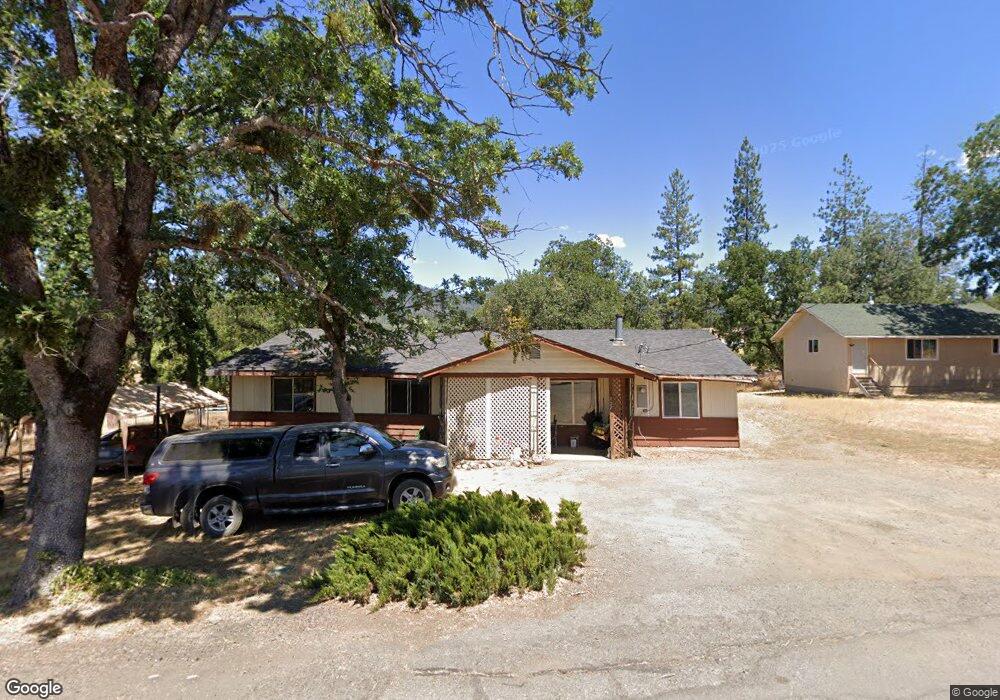
127 Highland Dr Hayfork, CA 96041
Estimated Value: $157,965 - $185,000
Studio
--
Bath
--
Sq Ft
20,909
Sq Ft Lot
About This Home
This home is located at 127 Highland Dr, Hayfork, CA 96041 and is currently estimated at $168,988. 127 Highland Dr is a home with nearby schools including Hayfork High School.
Ownership History
Date
Name
Owned For
Owner Type
Purchase Details
Closed on
Jul 30, 2014
Sold by
Sauer Johnathon B
Bought by
Woodhouse Jennifer L and Sauer Johnathon B
Current Estimated Value
Home Financials for this Owner
Home Financials are based on the most recent Mortgage that was taken out on this home.
Original Mortgage
$36,500
Interest Rate
4.13%
Mortgage Type
New Conventional
Purchase Details
Closed on
Jun 15, 2009
Sold by
Us Bank National Association
Bought by
Sauer Johnathon B
Home Financials for this Owner
Home Financials are based on the most recent Mortgage that was taken out on this home.
Original Mortgage
$40,000
Interest Rate
4.83%
Mortgage Type
Purchase Money Mortgage
Purchase Details
Closed on
Nov 7, 2008
Sold by
Sanford Tom S and Sanford Tamara K
Bought by
Us Bank National Association
Create a Home Valuation Report for This Property
The Home Valuation Report is an in-depth analysis detailing your home's value as well as a comparison with similar homes in the area
Home Values in the Area
Average Home Value in this Area
Purchase History
| Date | Buyer | Sale Price | Title Company |
|---|---|---|---|
| Woodhouse Jennifer L | -- | Trinity Co Title Co | |
| Sauer Johnathon B | $50,000 | California Title Company | |
| Us Bank National Association | $145,000 | None Available |
Source: Public Records
Mortgage History
| Date | Status | Borrower | Loan Amount |
|---|---|---|---|
| Closed | Woodhouse Jennifer L | $36,500 | |
| Closed | Sauer Johnathon B | $40,000 |
Source: Public Records
Tax History
| Year | Tax Paid | Tax Assessment Tax Assessment Total Assessment is a certain percentage of the fair market value that is determined by local assessors to be the total taxable value of land and additions on the property. | Land | Improvement |
|---|---|---|---|---|
| 2025 | $949 | $64,371 | $15,759 | $48,612 |
| 2024 | $941 | $63,109 | $15,450 | $47,659 |
| 2023 | $941 | $61,873 | $15,148 | $46,725 |
| 2022 | $926 | $60,660 | $14,851 | $45,809 |
| 2021 | $873 | $59,471 | $14,560 | $44,911 |
| 2020 | $829 | $58,862 | $14,411 | $44,451 |
| 2019 | $933 | $57,709 | $14,129 | $43,580 |
| 2018 | $933 | $56,578 | $13,852 | $42,726 |
| 2017 | $797 | $55,470 | $13,581 | $41,889 |
| 2016 | $774 | $54,383 | $13,315 | $41,068 |
| 2015 | $902 | $53,567 | $13,115 | $40,452 |
| 2014 | $760 | $52,519 | $12,859 | $39,660 |
Source: Public Records
Map
Nearby Homes
- 675 Hyampom
- 71 Tule Creek Rd
- 7021 California 3
- 7020 California 3
- 125 Cedar Gulch Rd
- Financing Miningclaim Ownership
- 1095 Hyampom Rd
- 134 Humboldt St
- 134 W Humboldt St
- 70 Oak Ave
- 355 Oliva Dr
- 305 Pine Ave
- 355 Pine Ave
- 480 Oliva Dr
- 420 Oliva Dr
- 310 Reservoir Rd
- 1240 Morgan Hill Rd
- 120 Hardy Ln
- 63 Michel St
- 2129 Brady Rd
Your Personal Tour Guide
Ask me questions while you tour the home.