Estimated Value: $276,434 - $462,000
3
Beds
2
Baths
1,850
Sq Ft
$190/Sq Ft
Est. Value
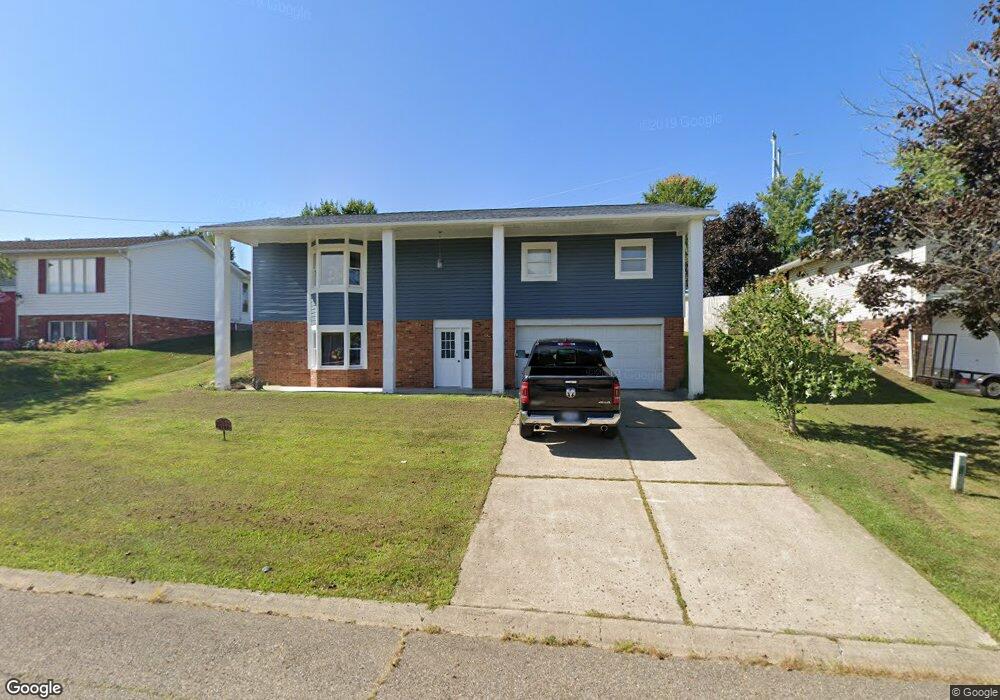
About This Home
This home is located at 127 Mae St, Logan, OH 43138 and is currently estimated at $352,359, approximately $190 per square foot. 127 Mae St is a home located in Hocking County with nearby schools including Central Elementary School, Logan Christian School, and St. John the Evangelist School.
Ownership History
Date
Name
Owned For
Owner Type
Purchase Details
Closed on
Apr 3, 2014
Sold by
Santos Quiles Maria M
Bought by
Cardenas Luis F
Current Estimated Value
Home Financials for this Owner
Home Financials are based on the most recent Mortgage that was taken out on this home.
Original Mortgage
$100,700
Outstanding Balance
$79,329
Interest Rate
5.34%
Mortgage Type
Adjustable Rate Mortgage/ARM
Estimated Equity
$273,030
Purchase Details
Closed on
Jul 14, 2004
Bought by
Cardenas, Luis F. 127 Mae St Logan, O
Create a Home Valuation Report for This Property
The Home Valuation Report is an in-depth analysis detailing your home's value as well as a comparison with similar homes in the area
Home Values in the Area
Average Home Value in this Area
Purchase History
| Date | Buyer | Sale Price | Title Company |
|---|---|---|---|
| Cardenas Luis F | $112,000 | None Available | |
| Cardenas, Luis F. 127 Mae St Logan, O | $112,000 | -- |
Source: Public Records
Mortgage History
| Date | Status | Borrower | Loan Amount |
|---|---|---|---|
| Open | Cardenas Luis F | $100,700 |
Source: Public Records
Tax History
| Year | Tax Paid | Tax Assessment Tax Assessment Total Assessment is a certain percentage of the fair market value that is determined by local assessors to be the total taxable value of land and additions on the property. | Land | Improvement |
|---|---|---|---|---|
| 2024 | $2,060 | $52,370 | $10,990 | $41,380 |
| 2023 | $2,060 | $52,370 | $10,990 | $41,380 |
| 2022 | $2,063 | $52,370 | $10,990 | $41,380 |
| 2021 | $1,645 | $38,700 | $8,710 | $29,990 |
| 2020 | $1,646 | $38,700 | $8,710 | $29,990 |
| 2019 | $1,647 | $38,700 | $8,710 | $29,990 |
| 2018 | $1,566 | $37,470 | $7,480 | $29,990 |
| 2017 | $1,475 | $37,470 | $7,480 | $29,990 |
| 2016 | $1,464 | $37,470 | $7,480 | $29,990 |
| 2015 | $1,662 | $40,980 | $6,840 | $34,140 |
| 2014 | $1,662 | $40,980 | $6,840 | $34,140 |
| 2013 | $1,669 | $40,980 | $6,840 | $34,140 |
Source: Public Records
Map
Nearby Homes
- 849 Mohican Ave
- 846 Elizabeth Ave
- 743 Summit Dr
- 32366 Lilac Ln
- 0 Lilac Ln Unit Lot 73
- State Route 328
- 0 Calico Ridge Rd Unit 226005949
- 226 W Front St
- 600 E 2nd St
- 235 W Main St
- 882 E Main St
- 385 W Main St
- 75 Hill St
- 680 E Hunter St
- 1300 Dannie Dr
- 48 Hill St
- 171 Warner Ave
- 394 Church St
- 331 Short St
- 171 West St
Your Personal Tour Guide
Ask me questions while you tour the home.