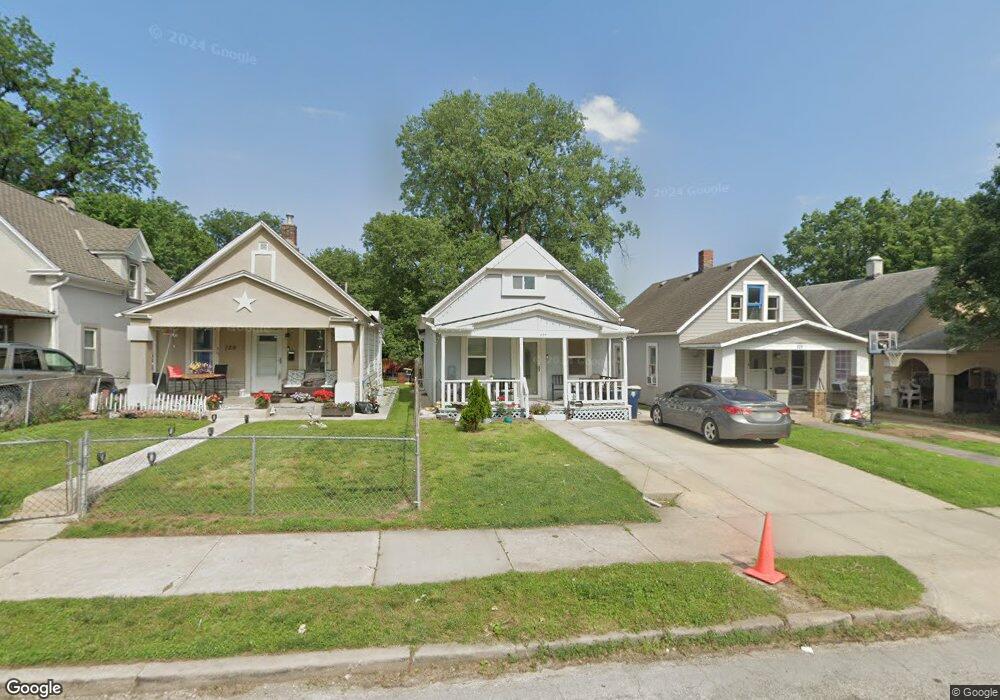
127 N Bellaire Ave Kansas City, MO 64123
North Indian Mound NeighborhoodEstimated Value: $104,000 - $117,000
2
Beds
1
Bath
760
Sq Ft
$144/Sq Ft
Est. Value
About This Home
This home is located at 127 N Bellaire Ave, Kansas City, MO 64123 and is currently estimated at $109,102, approximately $143 per square foot. 127 N Bellaire Ave is a home located in Jackson County with nearby schools including James Elementary School, Northeast Middle School, and Northeast High School.
Ownership History
Date
Name
Owned For
Owner Type
Purchase Details
Closed on
Apr 2, 2004
Sold by
Bills John C and Bills Norma J
Bought by
Cossio Salvador and Ramirez Maria J
Current Estimated Value
Home Financials for this Owner
Home Financials are based on the most recent Mortgage that was taken out on this home.
Original Mortgage
$24,900
Interest Rate
5.57%
Mortgage Type
Seller Take Back
Purchase Details
Closed on
Mar 26, 2004
Sold by
White Bobby G and White Carol
Bought by
Bills John C and Bills Norma J
Home Financials for this Owner
Home Financials are based on the most recent Mortgage that was taken out on this home.
Original Mortgage
$24,900
Interest Rate
5.57%
Mortgage Type
Seller Take Back
Purchase Details
Closed on
Mar 20, 2004
Sold by
Sterling Darrell D
Bought by
White Bobby G and White Carol
Home Financials for this Owner
Home Financials are based on the most recent Mortgage that was taken out on this home.
Original Mortgage
$24,900
Interest Rate
5.57%
Mortgage Type
Seller Take Back
Create a Home Valuation Report for This Property
The Home Valuation Report is an in-depth analysis detailing your home's value as well as a comparison with similar homes in the area
Home Values in the Area
Average Home Value in this Area
Purchase History
| Date | Buyer | Sale Price | Title Company |
|---|---|---|---|
| Cossio Salvador | -- | First American Title Ins Co | |
| Bills John C | -- | First American Title Ins Co | |
| White Bobby G | -- | First American Title Ins Co |
Source: Public Records
Mortgage History
| Date | Status | Borrower | Loan Amount |
|---|---|---|---|
| Closed | Cossio Salvador | $24,900 |
Source: Public Records
Tax History Compared to Growth
Tax History
| Year | Tax Paid | Tax Assessment Tax Assessment Total Assessment is a certain percentage of the fair market value that is determined by local assessors to be the total taxable value of land and additions on the property. | Land | Improvement |
|---|---|---|---|---|
| 2025 | $955 | $8,543 | $2,472 | $6,071 |
| 2024 | $946 | $12,103 | $1,461 | $10,642 |
| 2023 | $946 | $12,103 | $1,087 | $11,016 |
| 2022 | $531 | $6,460 | $1,862 | $4,598 |
| 2021 | $530 | $6,460 | $1,862 | $4,598 |
| 2020 | $508 | $6,124 | $1,862 | $4,262 |
| 2019 | $498 | $6,124 | $1,862 | $4,262 |
| 2018 | $356 | $4,469 | $610 | $3,859 |
| 2017 | $356 | $4,469 | $610 | $3,859 |
| 2016 | $349 | $4,357 | $561 | $3,796 |
| 2014 | $350 | $4,357 | $561 | $3,796 |
Source: Public Records
Map
Nearby Homes
- 120 N White Ave
- 124 N Topping Ave
- 106 Bellaire Ave
- 314 N Topping Ave
- 116 N Lawndale Ave
- 125 Bellaire Ave
- 5701 Saint John Ave
- 308 N Lawndale Ave
- 137 White Ave
- 335 N Lawndale Ave
- 5606 Scarritt Ave
- 320 N Belmont Blvd
- 300 Bellaire Ave
- 310 N Oakley Ave
- 301 Lawndale Ave
- 420 N White Ave
- 317 Topping Ave
- 426 N Wheeling Ave
- 405 N Oakley Ave
- 430 N Wheeling Ave
- 129 N Bellaire Ave
- 125 N Bellaire Ave
- 131 N Bellaire Ave
- 121 N Bellaire Ave
- 133 N Bellaire Ave
- 119 N Bellaire Ave
- 135 N Bellaire Ave
- 117 N Bellaire Ave
- 130 N Bellaire Ave
- 139 N Bellaire Ave
- 122 N Bellaire Ave
- 126 N Bellaire Ave
- 132 N Bellaire Ave
- 118 N Bellaire Ave
- 141 N Bellaire Ave
- 115 N Bellaire Ave Unit B
- 114 N Bellaire Ave
- 122 N White Ave Unit Upper Level
- 126 N White Ave
- 136 N Bellaire Ave