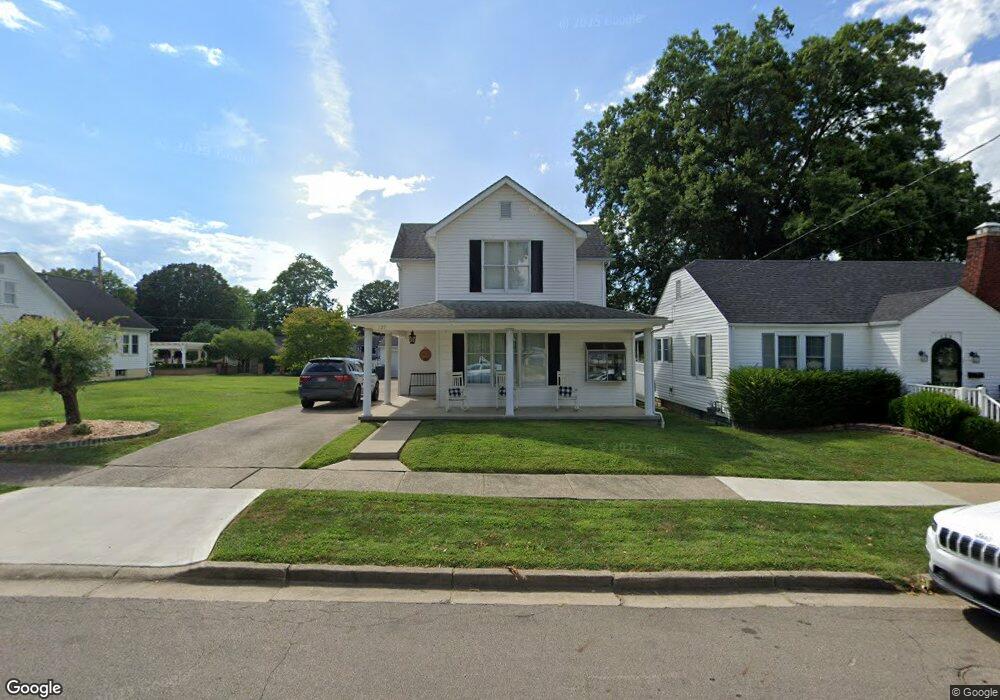
127 N David Ave Jackson, OH 45640
Estimated Value: $209,790 - $232,000
3
Beds
3
Baths
1,758
Sq Ft
$127/Sq Ft
Est. Value
About This Home
This home is located at 127 N David Ave, Jackson, OH 45640 and is currently estimated at $222,448, approximately $126 per square foot. 127 N David Ave is a home located in Jackson County with nearby schools including Jackson High School and Christian Life Academy.
Ownership History
Date
Name
Owned For
Owner Type
Purchase Details
Closed on
Mar 22, 2018
Sold by
Ruston Alfred T and Ruston Marolyn T
Bought by
Mcdaniel Cody A and Mcdaniel Hannah K
Current Estimated Value
Home Financials for this Owner
Home Financials are based on the most recent Mortgage that was taken out on this home.
Original Mortgage
$117,400
Outstanding Balance
$100,650
Interest Rate
4.4%
Mortgage Type
Future Advance Clause Open End Mortgage
Estimated Equity
$121,798
Purchase Details
Closed on
Aug 26, 2003
Sold by
Crabtree Oris
Bought by
Ruston Alfred T and Ruston Marolyn T
Purchase Details
Closed on
May 14, 1996
Bought by
Crabtree Oris
Create a Home Valuation Report for This Property
The Home Valuation Report is an in-depth analysis detailing your home's value as well as a comparison with similar homes in the area
Home Values in the Area
Average Home Value in this Area
Purchase History
| Date | Buyer | Sale Price | Title Company |
|---|---|---|---|
| Mcdaniel Cody A | $117,400 | None Available | |
| Ruston Alfred T | $85,000 | -- | |
| Crabtree Oris | -- | -- |
Source: Public Records
Mortgage History
| Date | Status | Borrower | Loan Amount |
|---|---|---|---|
| Open | Mcdaniel Cody A | $117,400 |
Source: Public Records
Tax History Compared to Growth
Tax History
| Year | Tax Paid | Tax Assessment Tax Assessment Total Assessment is a certain percentage of the fair market value that is determined by local assessors to be the total taxable value of land and additions on the property. | Land | Improvement |
|---|---|---|---|---|
| 2024 | $1,669 | $46,070 | $5,140 | $40,930 |
| 2023 | $1,698 | $46,070 | $5,140 | $40,930 |
| 2022 | $1,945 | $38,130 | $4,970 | $33,160 |
| 2021 | $1,516 | $38,130 | $4,970 | $33,160 |
| 2020 | $1,502 | $38,130 | $4,970 | $33,160 |
| 2019 | $1,323 | $32,860 | $4,280 | $28,580 |
| 2018 | $1,307 | $32,860 | $4,280 | $28,580 |
| 2017 | $1,163 | $32,860 | $4,280 | $28,580 |
| 2016 | $1,163 | $30,120 | $2,870 | $27,250 |
| 2015 | $1,120 | $30,120 | $2,870 | $27,250 |
| 2013 | $1,120 | $28,890 | $2,870 | $26,020 |
| 2012 | $1,136 | $28,890 | $2,870 | $26,020 |
Source: Public Records
Map
Nearby Homes