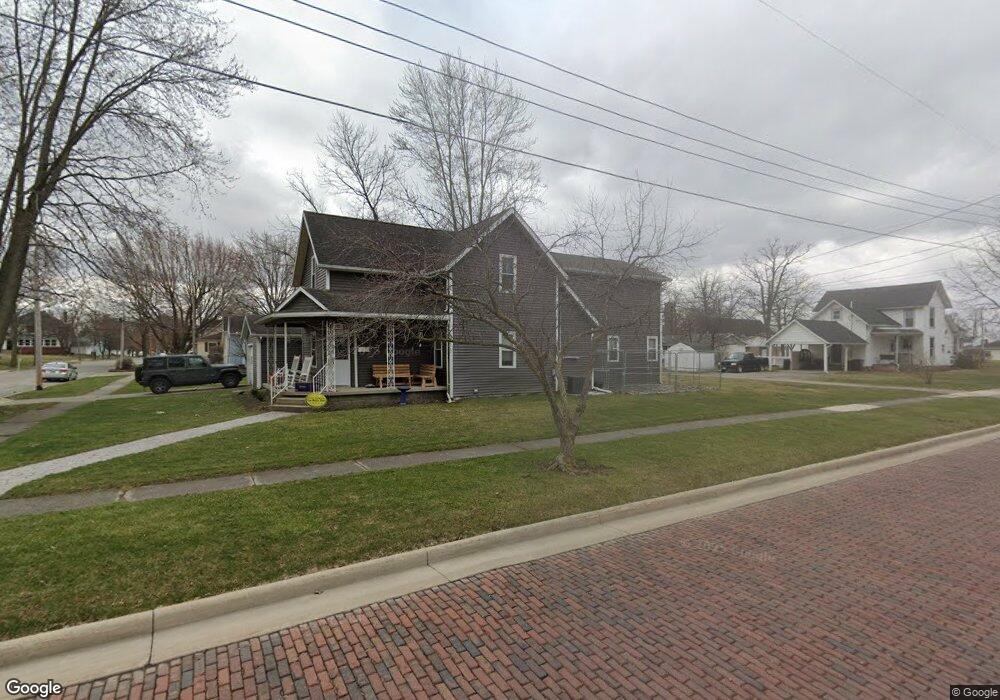
127 N Moe St Ottawa, OH 45875
Estimated Value: $196,000 - $262,000
2
Beds
2
Baths
1,416
Sq Ft
$153/Sq Ft
Est. Value
About This Home
This home is located at 127 N Moe St, Ottawa, OH 45875 and is currently estimated at $216,891, approximately $153 per square foot. 127 N Moe St is a home located in Putnam County with nearby schools including Ottawa-Glandorf High School and Sts. Peter & Paul Catholic School.
Ownership History
Date
Name
Owned For
Owner Type
Purchase Details
Closed on
Oct 5, 2011
Sold by
Jordan Brian K and Jordan Taryan L
Bought by
Schroeder Jacob R and Schroeder Allison C
Current Estimated Value
Home Financials for this Owner
Home Financials are based on the most recent Mortgage that was taken out on this home.
Original Mortgage
$93,800
Outstanding Balance
$64,375
Interest Rate
4.23%
Mortgage Type
New Conventional
Estimated Equity
$152,516
Purchase Details
Closed on
Sep 30, 2009
Sold by
Ruhe Ellen M and Ruhe Timothy D
Bought by
Jordan Ii Brian K and Jordan Taryn L
Home Financials for this Owner
Home Financials are based on the most recent Mortgage that was taken out on this home.
Original Mortgage
$82,110
Interest Rate
5.19%
Mortgage Type
New Conventional
Purchase Details
Closed on
Nov 21, 2007
Home Financials for this Owner
Home Financials are based on the most recent Mortgage that was taken out on this home.
Interest Rate
6.2%
Create a Home Valuation Report for This Property
The Home Valuation Report is an in-depth analysis detailing your home's value as well as a comparison with similar homes in the area
Home Values in the Area
Average Home Value in this Area
Purchase History
| Date | Buyer | Sale Price | Title Company |
|---|---|---|---|
| Schroeder Jacob R | $92,000 | Attorney | |
| Jordan Ii Brian K | $80,500 | None Available | |
| -- | $83,000 | -- |
Source: Public Records
Mortgage History
| Date | Status | Borrower | Loan Amount |
|---|---|---|---|
| Open | Schroeder Jacob R | $93,800 | |
| Closed | Jordan Ii Brian K | $82,110 | |
| Closed | -- | -- |
Source: Public Records
Tax History Compared to Growth
Tax History
| Year | Tax Paid | Tax Assessment Tax Assessment Total Assessment is a certain percentage of the fair market value that is determined by local assessors to be the total taxable value of land and additions on the property. | Land | Improvement |
|---|---|---|---|---|
| 2024 | $1,629 | $51,870 | $6,020 | $45,850 |
| 2023 | $1,682 | $42,020 | $4,670 | $37,350 |
| 2022 | $1,546 | $42,018 | $4,669 | $37,349 |
| 2021 | $1,405 | $37,960 | $4,670 | $33,290 |
| 2020 | $1,413 | $21,440 | $4,170 | $17,270 |
| 2019 | $860 | $22,890 | $4,670 | $18,220 |
| 2018 | $841 | $22,890 | $4,670 | $18,220 |
| 2017 | $801 | $22,890 | $4,670 | $18,220 |
| 2016 | $801 | $21,440 | $4,170 | $17,270 |
| 2015 | $807 | $21,440 | $4,170 | $17,270 |
| 2014 | $796 | $21,440 | $4,170 | $17,270 |
| 2013 | $794 | $21,440 | $4,170 | $17,270 |
Source: Public Records
Map
Nearby Homes
- 1006 E 2nd St
- 740 E Main St
- 717 E 2nd St
- 1417 E 3rd St
- 370 S Thomas St
- 443 E 4th St
- 1709 S Agner St
- 0 Sapphire St Unit 225029940
- 530 N Taft Ave
- 1854 S Agner St
- 195 Eastland Dr
- 445 S Oak St
- 717 & 717 1/2 & 721 E Third St
- 304 Oakview (Unit E) Dr
- 148 Pawnee Dr
- #11 Oakview Dr
- #10 Oakview Dr
- #9 Oakview Dr
- #8 Oakview Dr
- #7 Oakview Dr