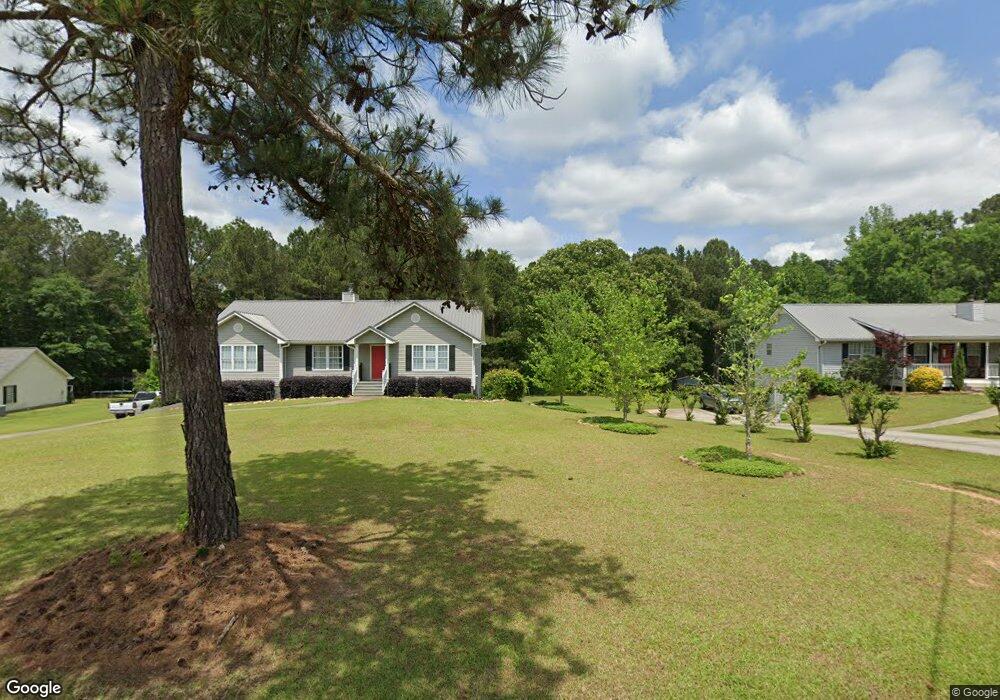
127 Pasha Dr Brooks, GA 30205
Estimated Value: $351,816 - $599,000
Studio
--
Bath
1,500
Sq Ft
$289/Sq Ft
Est. Value
About This Home
This home is located at 127 Pasha Dr, Brooks, GA 30205 and is currently estimated at $433,204, approximately $288 per square foot. 127 Pasha Dr is a home located in Fayette County with nearby schools including Peeples Elementary School, Whitewater Middle School, and Whitewater High School.
Ownership History
Date
Name
Owned For
Owner Type
Purchase Details
Closed on
Jun 26, 2007
Sold by
Mucha Joyce M
Bought by
Mucha Christopher M and Mucha Joyce M
Current Estimated Value
Purchase Details
Closed on
Oct 15, 2002
Sold by
Mucha Christopher M
Bought by
Mucha Joyce M
Home Financials for this Owner
Home Financials are based on the most recent Mortgage that was taken out on this home.
Original Mortgage
$132,000
Interest Rate
6.21%
Mortgage Type
New Conventional
Purchase Details
Closed on
May 25, 2001
Sold by
'Mucha Christopher and 'Mucha Joyce M
Bought by
'Mucha Joyce M
Home Financials for this Owner
Home Financials are based on the most recent Mortgage that was taken out on this home.
Original Mortgage
$119,000
Interest Rate
7.05%
Mortgage Type
New Conventional
Purchase Details
Closed on
Nov 8, 1995
Sold by
South Fayette Homes
Bought by
Mucha Christopher M
Create a Home Valuation Report for This Property
The Home Valuation Report is an in-depth analysis detailing your home's value as well as a comparison with similar homes in the area
Home Values in the Area
Average Home Value in this Area
Purchase History
| Date | Buyer | Sale Price | Title Company |
|---|---|---|---|
| Mucha Christopher M | -- | -- | |
| Mucha Joyce M | -- | -- | |
| Mucha Joyce M | -- | -- | |
| 'Mucha Joyce M | -- | -- | |
| Mucha Christopher M | $19,900 | -- |
Source: Public Records
Mortgage History
| Date | Status | Borrower | Loan Amount |
|---|---|---|---|
| Previous Owner | Mucha Joyce M | $132,000 | |
| Previous Owner | 'Mucha Joyce M | $119,000 |
Source: Public Records
Tax History
| Year | Tax Paid | Tax Assessment Tax Assessment Total Assessment is a certain percentage of the fair market value that is determined by local assessors to be the total taxable value of land and additions on the property. | Land | Improvement |
|---|---|---|---|---|
| 2025 | $995 | $141,946 | $36,650 | $105,296 |
| 2024 | $963 | $132,660 | $34,252 | $98,408 |
| 2023 | $855 | $123,740 | $30,100 | $93,640 |
| 2022 | $1,378 | $115,744 | $26,984 | $88,760 |
| 2021 | $1,362 | $103,388 | $24,908 | $78,480 |
| 2020 | $1,695 | $95,476 | $22,076 | $73,400 |
| 2019 | $1,602 | $89,316 | $22,076 | $67,240 |
| 2018 | $2,238 | $81,308 | $19,068 | $62,240 |
| 2017 | $2,198 | $75,540 | $18,060 | $57,480 |
| 2016 | $2,032 | $68,300 | $18,060 | $50,240 |
| 2015 | $1,935 | $63,860 | $18,060 | $45,800 |
| 2014 | -- | $58,420 | $18,060 | $40,360 |
| 2013 | -- | $55,740 | $0 | $0 |
Source: Public Records
Map
Nearby Homes
- 460 Mask Rd
- LOT 8 Mask Road - Hanner's Farm S
- LOT 7 Mask Road - Hanner's Farm S
- 100 Fairview Rd
- LOT 5 Mask Road - Hanner's Farm N
- LOT 6 Mask Road - Hanner's Farm N
- LOT 4 Mask Road - Hanner's Farm N
- LOT 3 Mask Road - Hanner's Farm N
- 161 Mockingbird Ln
- 210 Mockingbird Ln
- 160 Carrington Ln
- 130 Brooklet Way
- 152 Carson Rd
- 0 Mask Rd Unit 10671477
- 9902 Highway 16
- 240 Avalee Rd
- NEXT TO 443 W Mcintosh Rd
- 0 W Mcintosh Rd Unit 10654779
- 911 Highway 85 Connector
- 395 W Mcintosh Rd
Your Personal Tour Guide
Ask me questions while you tour the home.