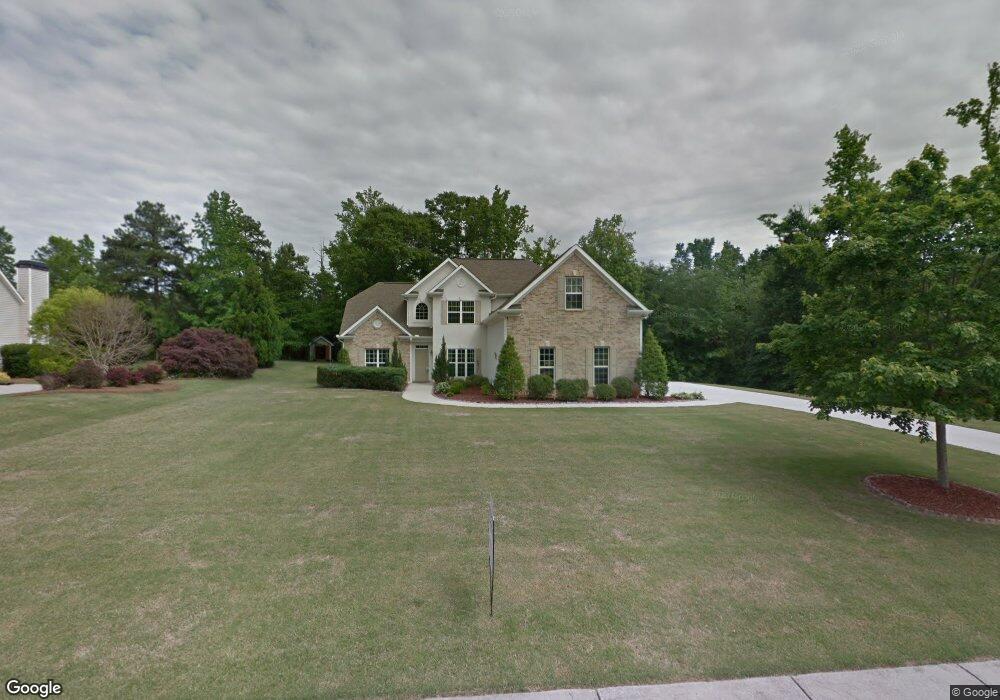
127 Persimmon Dr Sharpsburg, GA 30277
Estimated Value: $602,706 - $676,000
5
Beds
4
Baths
2,912
Sq Ft
$218/Sq Ft
Est. Value
About This Home
This home is located at 127 Persimmon Dr, Sharpsburg, GA 30277 and is currently estimated at $634,927, approximately $218 per square foot. 127 Persimmon Dr is a home located in Coweta County with nearby schools including Canongate Elementary School, Madras Middle School, and Northgate High School.
Ownership History
Date
Name
Owned For
Owner Type
Purchase Details
Closed on
Aug 3, 2016
Sold by
Judith M Richardson
Bought by
Cipriano Michael
Current Estimated Value
Home Financials for this Owner
Home Financials are based on the most recent Mortgage that was taken out on this home.
Original Mortgage
$316,825
Outstanding Balance
$252,103
Interest Rate
3.48%
Estimated Equity
$382,824
Purchase Details
Closed on
Apr 13, 2006
Sold by
Beta Const Inc
Bought by
Richardson Troy and Richardson Judith M
Home Financials for this Owner
Home Financials are based on the most recent Mortgage that was taken out on this home.
Original Mortgage
$60,300
Interest Rate
6.29%
Mortgage Type
New Conventional
Purchase Details
Closed on
Sep 15, 2005
Sold by
D Brent Llc
Bought by
Beta Construction Inc
Purchase Details
Closed on
Sep 25, 2003
Sold by
D Brent Llc
Bought by
D Brent Llc
Create a Home Valuation Report for This Property
The Home Valuation Report is an in-depth analysis detailing your home's value as well as a comparison with similar homes in the area
Home Values in the Area
Average Home Value in this Area
Purchase History
| Date | Buyer | Sale Price | Title Company |
|---|---|---|---|
| Cipriano Michael | -- | -- | |
| Richardson Troy | $301,600 | -- | |
| Beta Construction Inc | $1,113,000 | -- | |
| D Brent Llc | $5,000,000 | -- |
Source: Public Records
Mortgage History
| Date | Status | Borrower | Loan Amount |
|---|---|---|---|
| Open | Cipriano Michael | $316,825 | |
| Closed | Cipriano Michael | -- | |
| Previous Owner | Richardson Troy | $60,300 | |
| Previous Owner | Richardson Troy | $241,200 |
Source: Public Records
Tax History Compared to Growth
Tax History
| Year | Tax Paid | Tax Assessment Tax Assessment Total Assessment is a certain percentage of the fair market value that is determined by local assessors to be the total taxable value of land and additions on the property. | Land | Improvement |
|---|---|---|---|---|
| 2025 | $4,727 | $206,437 | $36,000 | $170,437 |
| 2024 | $4,586 | $202,134 | $36,000 | $166,134 |
| 2023 | $4,586 | $181,832 | $32,000 | $149,832 |
| 2022 | $4,161 | $173,602 | $32,000 | $141,602 |
| 2021 | $3,479 | $136,829 | $24,000 | $112,829 |
| 2020 | $3,501 | $136,829 | $24,000 | $112,829 |
| 2019 | $3,701 | $131,262 | $24,000 | $107,262 |
| 2018 | $3,709 | $131,262 | $24,000 | $107,262 |
| 2017 | $3,712 | $126,632 | $24,000 | $102,632 |
| 2016 | $3,444 | $118,915 | $24,000 | $94,915 |
| 2015 | $3,232 | $113,513 | $24,000 | $89,513 |
| 2014 | $3,053 | $108,112 | $24,000 | $84,112 |
Source: Public Records
Map
Nearby Homes
- 9 Warrior Way
- 35 Palmer Place
- 20 Skipton Ct
- 291 Cannongate Rd
- 40 Joe Lee Dr
- 30 Joe Lee Dr
- 70 N Strathmore Dr
- 56 Hudgen Rd
- 518 Palmetto Tyrone Rd
- 40 Wenham Ln
- 10 Monteray Ct
- 0 Fischer Spur Rd Unit 10495301
- 78 Rosebay Ln
- 110 Kylemore Pass
- 32 Riverbirch Way
- 104 Ashland Trail
- 259 Strathmore Dr Unit 3
- 100 Ashland Trail
- 150 Kylemore Pass
- 200 Chaparral Trace
- 141 Persimmon Dr
- 117 Persimmon Dr
- 126 Persimmon Dr
- 190 Sweet Bay Dr
- 161 Persimmon Dr
- 161 Persimmon Dr Unit 37
- 22 Tee Pee Row
- 102 Persimmon Dr
- 87 Persimmon Dr
- 168 Sweet Bay Dr
- 210 Sweet Bay Dr Unit 10
- 210 Sweet Bay Dr
- 152 Sweet Bay Dr
- 20 Tee Pee Row
- 21 Tee Pee Row
- 106 Sweet Bay Dr
- 71 Persimmon Dr
- 64 Persimmon Dr
- 0 Sweet Bay Dr Unit 8603619
- 0 Sweet Bay Dr Unit 8165619